


You read a lithium-ion battery voltage chart by matching the voltage value to the battery’s charge level. This chart shows how much energy your battery holds at each voltage point. When you check a battery voltage chart, you can easily see if your battery is full, half-charged, or needs charging.
- You can track remaining energy and make smart adjustments.
- The chart helps you avoid overcharge or deep discharge, which keeps your battery safe and long-lasting.
- Using the chart lets you get the best performance from every lithium-ion battery.
Lithium-Ion Battery Voltage Chart

What It Shows
A lithium-ion battery voltage chart helps you see how much energy your battery has left. This chart shows the link between the battery’s voltage and its charge level. You use it to check if your battery is full, half-full, or almost empty. The main purpose of a lithium-ion battery voltage chart is to help you manage your battery’s performance and keep it safe. When you look at the chart, you can match the voltage reading to the battery’s state of charge. This makes it easy to know when to charge or stop using your battery.
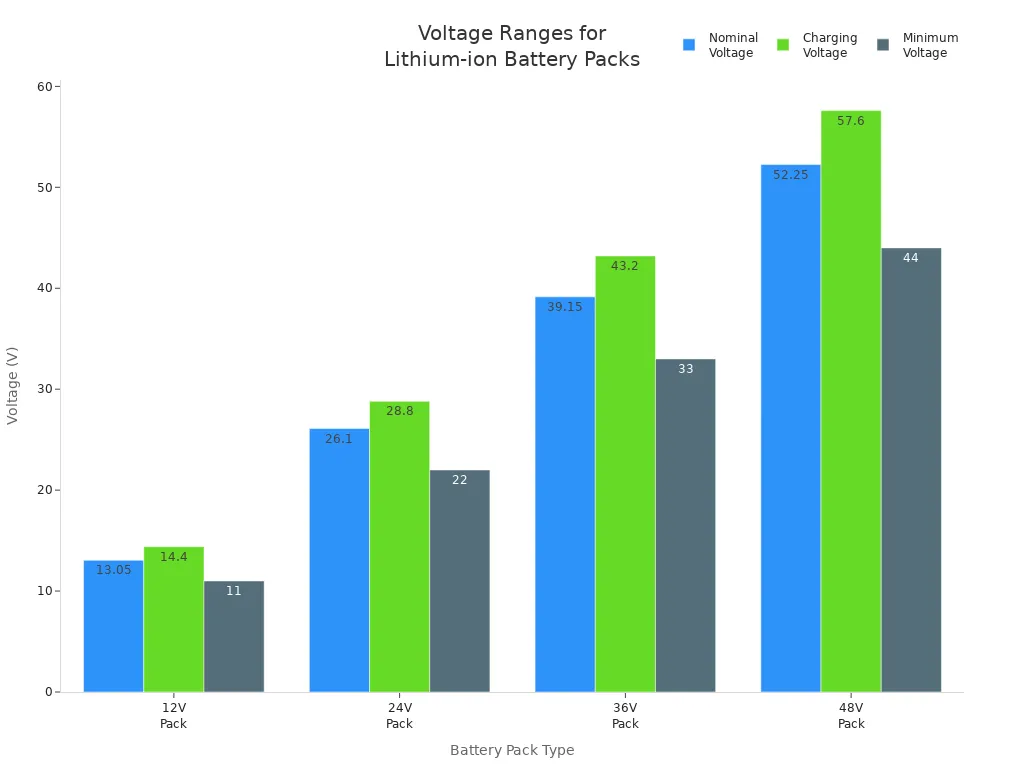
You will find that different lithium-ion batteries have different voltage ranges. For example, a single lithium-ion cell usually has a nominal voltage of about 3.6 to 3.7 volts. Packs like 12V, 24V, 36V, and 48V have their own voltage ranges. The table below shows common values you might see on a battery voltage chart:
| Battery Type / Pack Voltage | Typical Voltage Range or Value |
|---|---|
| Single Lithium-ion Cell Nominal Voltage | ~3.6 to 3.7 V per cell |
| LiFePO4 Cell Nominal Voltage | ~3.2 V per cell |
| Charging Voltage per Cell (Li-ion) | 4.2 to 4.3 V (upper limit) |
| Charging Voltage per Cell (LiFePO4) | 3.6 to 3.8 V (upper limit) |
| Discharge Cut-off Voltage (Li-ion) | 2.5 to 3.0 V per cell |
| Discharge Cut-off Voltage (LiFePO4) | 2.8 to 3.2 V per cell |
| 12V Pack (Nominal) | ~12.8 to 13.3 V depending on state of charge |
| 12V Pack (Charging Voltage) | 14.2 to 14.6 V |
| 12V Pack (Minimum Voltage) | 10 to 12 V |
| 24V Pack (Nominal) | ~25.6 to 26.6 V depending on state of charge |
| 24V Pack (Charging Voltage) | 28.4 to 29.2 V |
| 24V Pack (Minimum Voltage) | 20 to 24 V |
| 36V Pack (Nominal) | ~38.4 to 39.9 V depending on state of charge |
| 36V Pack (Charging Voltage) | 42.6 to 43.8 V |
| 36V Pack (Minimum Voltage) | 30 to 36 V |
| 48V Pack (Nominal) | ~51.2 to 53.3 V depending on state of charge |
| 48V Pack (Charging Voltage) | 56.8 to 58.4 V |
| 48V Pack (Minimum Voltage) | 40 to 48 V |
You can also see these values in a grouped bar chart:
Voltage and State of Charge
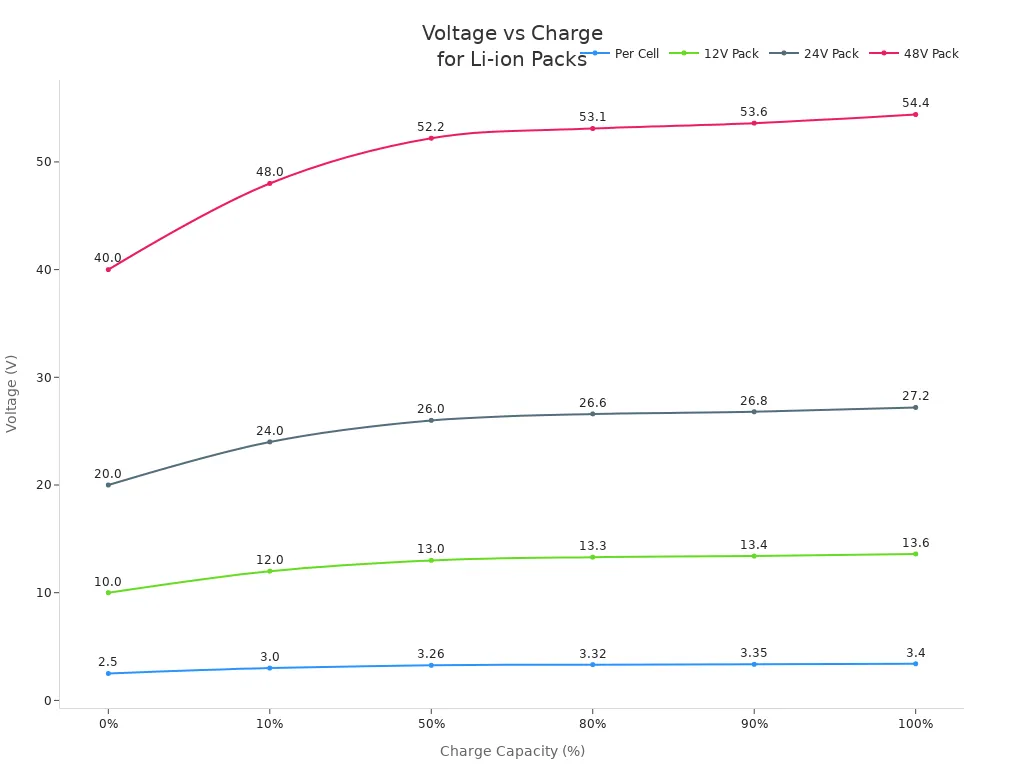
The battery voltage chart shows how voltage changes as the battery’s charge drops from full to empty. When your battery is at 100% charge, the voltage is at its highest. As you use the battery, the voltage slowly drops. When the battery is empty, the voltage reaches its lowest safe value. The 48v battery voltage chart is a good example of how these numbers change as the battery discharges.
Here is a table that links voltage to charge level for different battery packs, including the 48v battery voltage chart:
| Charge Capacity (%) | Voltage per Cell (V) | 12V Pack (V) | 24V Pack (V) | 48V Pack (V) |
|---|---|---|---|---|
| 100% | 3.40 | 13.6 | 27.2 | 54.4 |
| 90% | 3.35 | 13.4 | 26.8 | 53.6 |
| 80% | 3.32 | 13.3 | 26.6 | 53.1 |
| 50% | 3.26 | 13.0 | 26.0 | 52.2 |
| 10% | 3.00 | 12.0 | 24.0 | 48.0 |
| 0% | 2.50 | 10.0 | 20.0 | 40.0 |
You can also see this relationship in a line chart:
Tip: The voltage does not drop in a straight line as the battery discharges. The curve is not linear. Factors like temperature and how fast you use the battery can change the voltage reading. Always use the battery voltage chart as a guide, not the only tool, for checking your battery’s state of charge.
Interpreting Battery Voltage Chart
Key Voltage Points
When you look at a battery voltage chart, you see how the voltage changes as the battery goes from full charge to empty. The chart shows three main voltage points. The first is Vo, which is the voltage at full charge. This is the highest point on the chart. The second is Vm, which stands for the middle voltage. This point shows a partial charge. The last is Voff, which is the lowest voltage before the battery is fully depleted. You can use these points to tell if your battery is full, partly used, or needs charging.
As you use your lithium-ion battery, the voltage drops. The battery voltage chart helps you track this drop. When you see the voltage near Vo, you know the battery is at full charge. If the voltage is closer to Vm, the battery is partly used. When the voltage gets near Voff, the battery is almost empty. This pattern repeats every time you charge and discharge your battery.
Tip: The voltage does not always drop in a straight line. The curve on the chart may look flat in the middle and steep at the ends. This means the battery holds its voltage for a while, then drops quickly as the charge depletes.
State of Charge Levels
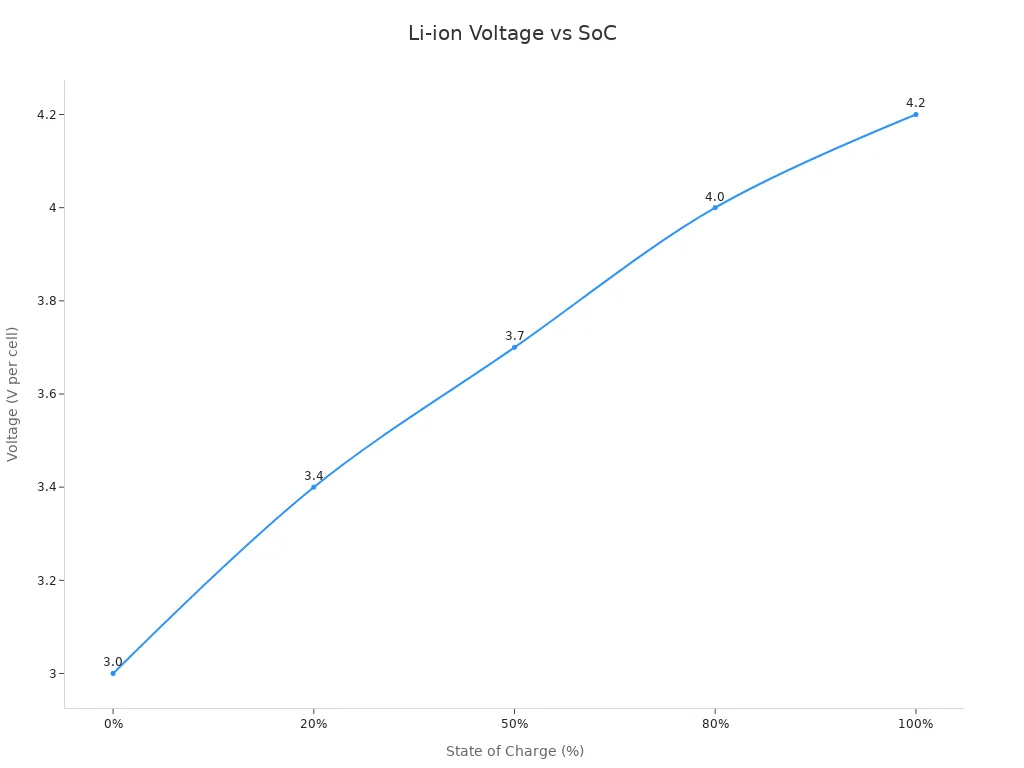
You can use a battery percentage chart to match voltage readings to the state of charge. This makes it easy to know how much energy you have left. The chart below shows how voltage relates to battery percentage for a typical lithium-ion cell:
| Состояние заряда (SoC) | Voltage (per cell) |
|---|---|
| 100% (Full charge) | ~4.2 V |
| 80% | ~4.0 V |
| 50% | ~3.7 V |
| 20% | ~3.4 V |
| 0% (Depleted) | ~3.0 V |
If you use a 12V lithium-ion battery, you can check the battery voltage chart for pack voltages. For example, a 12V battery at rest shows about 13.6V at full charge, 13.0V at half charge, and 10.0V when empty. Always measure the voltage when the battery is not charging or discharging for the most accurate reading.
The battery percentage chart helps you estimate how much charge remains. You can see that the voltage stays steady in the middle range, but drops fast as the charge depletes near the end. This curve is important for knowing when to stop using the battery to avoid deep discharge.
Note: The voltage-to-charge relationship is not always exact. Factors like temperature, battery age, and chemistry can change the numbers. Always use the chart as a guide, not the only tool.
The 20-80 Rule for Battery Longevity
To make your lithium-ion battery last longer, you can follow the 20-80 rule. This means you keep the charge between 20% and 80% most of the time. On the battery voltage chart, this is about 3.2V to 4.15V per cell when the battery is at rest. Charging above 4.15V or discharging below 3.2V can stress the battery and shorten its life. Many devices use a battery management system to help you stay in this safe range.
You do not need to follow this rule all the time. Sometimes you may need a full charge for a long trip. But if you keep your battery between these points most days, you will get more cycles and better performance.
⚡ Keeping your battery between 20% and 80% charge helps prevent damage and extends its lifespan. Use the battery voltage chart to check if you are in the safe zone.
Factors Affecting Lithium-Ion Voltage
Температура
Temperature changes can make a big difference in how your lithium-ion battery works. When you use your battery in cold weather, the electrolyte inside thickens. This slows down ion movement and increases resistance. You might notice the voltage drops quickly, and your device may shut off even if the battery still has charge left. At temperatures below 0°C, the battery can lose more than 40% of its discharge capacity. Charging and discharging at low temperatures can also damage the battery, especially if you try to charge it below freezing. High temperatures, above 45°C, speed up chemical reactions. This can cause the voltage to rise for a short time, but it also makes the battery age faster and can lead to swelling or even safety problems.
- At low temperatures, voltage readings drop and discharge capacity falls.
- At high temperatures, voltage may rise, but battery health suffers.
- Battery management systems help adjust voltage readings and protect your battery during charging and discharging.
Tip: Try to use and store your lithium-ion batteries between -20°C and 60°C for discharging, and 0°C to 45°C for charging. This helps keep voltage readings accurate and your battery safe.
Скорость разряда
The rate at which you discharge your lithium-ion battery affects its voltage profile. If you use your device with a heavy load, the battery voltage drops quickly. This happens because the battery’s internal chemistry cannot keep up with the fast discharge. You may see your device shut down sooner than expected. When you use a light load, the voltage stays more stable, and you get more usable capacity from the battery. Fast discharge rates can also shorten the battery’s life over time. For the most accurate voltage readings, check the battery when it is at rest, not under heavy use.
Химия аккумулятора
Not all lithium-ion batteries are the same. The chemistry inside changes how the voltage behaves during charging and discharging. For example, LiFePO4 batteries have a nominal voltage of about 3.2V per cell. NMC batteries have a higher nominal voltage, around 3.6V to 3.7V per cell. LiFePO4 batteries are safer and last longer, but they do not work well at low temperatures. NMC batteries are smaller and lighter, but they are more sensitive to temperature and have a shorter cycle life. The voltage curve for each chemistry looks different, so always check the right chart for your battery type.
| Химия | Номинальное напряжение (В) | Срок службы цикла (циклы) | Temperature Sensitivity |
|---|---|---|---|
| LiFePO4 | 3.2 | Up to 5000 | Высокий |
| NMC | 3.6–3.7 | 500–800 | Выше |
Note: Always use the correct voltage chart for your battery’s chemistry to avoid mistakes during charging and discharging.
Practical Tips for Accurate Voltage Measurement
- Используйте reliable multimeter or battery tester for voltage checks.
- Clean battery terminals to avoid errors.
- Measure voltage when the battery is at rest, not during charging and discharging.
- Keep your battery between 20% and 80% charge for best results.
- Watch out for temperature changes, as they can affect voltage readings.
- Follow safety instructions and use a battery management system for extra protection.
Charge-Discharge Curves

Understanding the Curve
When you look at charge-discharge curves, you see how your battery’s voltage changes during charging and discharging. The charge curve shows how voltage rises as you add energy. At first, the battery charges with a constant current, and the voltage goes up. As the battery gets close to full, the charger switches to constant voltage mode. The current drops while the voltage stays steady until the battery is full.
The discharge curve tells you how voltage drops as you use the battery. For most of the discharge, the curve stays flat, which means the voltage does not change much even as you use energy. This flat part helps you know the state of charge. Near the end, the discharge curve drops quickly. This sharp fall means the battery is almost empty. If you keep using the battery past this point, you risk damaging it. The rapid voltage drop near depletion acts as a warning. Most battery management systems stop discharge before the voltage gets too low, usually around 2.5V to 2.7V per cell, to protect the battery.
Note: Charge-discharge curves and voltage charts work together. The curve shows real-time changes, while the chart summarizes the link between voltage and state of charge.
Battery Health Insights
You can use the shape of the discharge curve to check your battery’s health. A healthy battery has a long, flat plateau in the discharge curve. If the curve starts to slope down sooner or the plateau gets shorter, your battery may be losing capacity. The slope of the curve also tells you about internal resistance. If the curve becomes steeper, the battery has higher resistance, which means less power and shorter run time.
- A long, flat discharge curve means good capacity.
- A steep or uneven curve can signal aging or damage.
- Changes in the curve over time help you spot early signs of battery degradation.
Battery management systems often track these curves to monitor health. By watching for changes in the discharge curve, you can catch problems early. This helps you replace or care for your battery before it fails. The curve gives you a simple way to see how well your battery performs and how much life it has left.
Best Practices and Mistakes
Common Errors
When you use a battery voltage chart, you might make some common mistakes. These errors can lead to wrong readings or even damage your battery. Here are some mistakes you should watch out for:
- Misreading the chart by not matching the correct voltage to your battery type.
- Relying only on the battery voltage chart without checking other signs of battery health.
- Measuring voltage while the battery is charging or under heavy load, which gives false results.
- Ignoring the effects of temperature or not letting the battery rest before taking a reading.
- Discharging the battery too deeply, which can cause permanent damage.
- Overcharging or charging above the safe voltage range shown on the chart.
⚠️ Always double-check your chart and follow the manufacturer’s instructions to avoid these mistakes.
Reliable Use Tips
You can keep your lithium-ion battery safe and healthy by following some best practices. These steps help you get the most accurate readings from your battery voltage chart and extend your battery’s life.
- Use a high-quality multimeter to measure voltage. Connect it safely to the battery terminals.
- Always compare your voltage reading to the chart and the manufacturer’s specifications.
- Check the voltage when the battery is at rest, not during charge or discharge.
- Perform regular voltage checks to track battery health over time.
- Держите батарею между 20% и 80% заряд. This reduces wear from deep discharge or overcharge.
- Store and charge batteries in cool, fireproof places. Avoid charging inside living areas.
- Inspect your battery for swelling or damage. Move any deformed battery to a safe area right away.
- Use a Battery Management System (BMS) to protect against overcharge, over-discharge, and short circuits.
- Clean battery terminals to prevent poor connections and false readings.
Following these tips helps you avoid deep discharge, which can cause up to 25% capacity loss if you let the battery run too low. By using the battery voltage chart correctly, you can spot problems early and keep your battery working longer.
A battery voltage chart is a helpful tool, but you should always use it with care. Combine chart readings with regular inspections and safe handling. This way, you protect your battery and get the best performance from every charge and discharge cycle.
You can read lithium-ion battery voltage charts by matching voltage values to charge levels and checking for safe ranges. Always consider factors like temperature and discharge rate, since these affect voltage, capacity, and battery safety. Using voltage charts helps you monitor battery health, avoid overcharging, and extend battery life.
- Temperature changes can raise or lower voltage and impact battery performance.
- Высокая скорость разряда reduce capacity and increase heat.
If you want to learn more, explore resources like Battery University, ScienceDirect, or the U.S. Department of Energy.
ЧАСТО ЗАДАВАЕМЫЕ ВОПРОСЫ
How do you measure the voltage of a lithium-ion battery?
You use a digital multimeter. Set it to DC voltage. Touch the red probe to the positive terminal and the black probe to the negative terminal. Read the voltage on the display. Make sure the battery is at rest for the most accurate result.
Why does my battery voltage drop quickly near empty?
The voltage drops fast near empty because the battery has little energy left. This steep drop warns you to stop using the battery. If you keep using it, you risk damaging the battery and losing capacity.
Can you use voltage alone to check battery health?
No, voltage gives you a quick estimate of charge. It does not show full battery health. You should also check for swelling, heat, and changes in run time. Use a battery management system for better monitoring.
What happens if you charge a lithium-ion battery below freezing?
Charging below 0°C can damage the battery. The chemical reactions slow down, and lithium plating may occur. This can cause permanent capacity loss or safety risks. Always charge your battery in a warmer environment.
How often should you check your battery voltage?
Check your battery voltage once a month if you use it often. For storage, check every three months. Regular checks help you spot problems early and keep your battery safe.