

A battery’s discharge curve is its performance resume. It shows exactly how its voltage behaves under load. This graph is the key to answering critical questions.
How much energy can a user really get from this battery? How long will it last in a specific device? 🔋
In 2025, power-hungry electronics are everywhere. The 3,001–10,000 mAh battery segment, for instance, powered a significant 34.5% of the market in 2024. Understanding how factors like discharge rate and temperature warp the curve is essential for reliable performance and achieving Optimal Usage Patterns.
Anatomy of a Discharge Curve
A typical discharge curve has three distinct parts. The first is a quick initial voltage drop. The last is a rapid fall-off. The most important part is the long, flat section in the middle. Understanding these phases helps users predict device behavior.
The Stable Voltage Plateau
The stable voltage plateau is the longest phase of the discharge process. Here, the battery outputs a consistent voltage while delivering most of its energy. This stability is crucial for electronic devices to function correctly.
Inside the cell, a fascinating chemical reaction occurs. Electrons flow from the anode and find empty spots in the cathode material, like in LiFePO4. This movement attracts lithium ions (Li+) to form a new chemical phase. This process happens at the battery’s core energy level. Therefore, the voltage does not change much as the battery discharges. This steady chemical transformation provides the flat, predictable voltage that users rely on.
The ‘Knee’ and Cutoff Point
The “knee” of the curve is the point where the stable plateau ends. The voltage begins to drop sharply. This signals that the battery is nearly empty. Continuing to draw power past this point can damage the cell.
To prevent this damage, every battery has a designated cutoff voltage. This is the minimum safe voltage before the device should shut down.
Discharging a Li-ion cell below its cutoff voltage can cause permanent capacity loss, internal damage, and serious safety risks. ⚠️
Most modern 3.7V Li-ion cells have a cutoff voltage set between 2.75V and 3.0V. The exact value depends on the cell’s specific chemistry.
| Type de chimie | Typical Cutoff Voltage |
|---|---|
| Classic Cobalt-Based (LCO) | 2.8V – 3.0V |
| Lithium ternaire (NMC/NCA) | 2.8V – 3.0V |
Respecting this limit is essential for ensuring a long and reliable service life for the battery.
Impact of Discharge Rate (C-Rate)

The C-rate is a universal language for battery performance. It measures how fast a battery is discharged relative to its maximum capacity. The C-rate formula is the discharge current divided by the battery’s capacity in amp-hours. Understanding this rate is key to predicting real-world performance.
- A 1C rate discharges a battery in one hour.
- A 0.5C (or C/2) rate discharges it in two hours.
- A 2C rate discharges it in 30 minutes.
This number directly controls the shape of the discharge curve and the total energy a user can access.
Low C-Rate Discharging
A low C-rate discharge occurs when a device draws a small amount of current over a long period. This is the ideal scenario for maximizing energy output. The discharge curve shows a long, stable voltage plateau and delivers close to the battery’s full advertised capacity.
Remarque : Discharging at a low rate (e.g., 0.2C) allows the battery’s internal chemistry to keep pace with the demand. This results in higher efficiency and more usable energy.
This gentle usage pattern is perfect for low-power electronics. Devices like environmental sensors, remote controls, or simple wearables benefit from this efficiency, enjoying longer operational times between charges.
High C-Rate Discharging
High C-rate discharging happens when a device demands a large burst of power. This intense demand immediately causes “voltage sag,” a sharp drop in voltage at the very beginning of the discharge cycle. This increased internal resistance also generates more heat and reduces the total available capacity. The battery will hit its cutoff voltage much sooner.
High-drain applications like drones, RC cars, and power tools require this kind of performance. These devices often demand discharge rates from 5C to over 30C. This need created a split in battery design, leading to two distinct types of cells.
| Cell Type | Primary Goal | Meilleur pour |
|---|---|---|
| Energy Cell | Maximize capacity (mAh) | Low-drain devices (phones, laptops) |
| Power Cell | Maximize current delivery (C-rate) | High-drain devices (drones, power tools) |
Choosing the right cell type is critical. An energy cell in a power tool would suffer from extreme voltage sag and a short lifespan.
How Temperature Affects Performance
Temperature is another critical factor that dramatically alters a battery’s discharge curve. Every Li-ion cell has an ideal operating window, typically between 15°C and 30°C (59°F to 86°F). Outside this range, performance and safety can decline. Both extreme cold and heat present unique challenges for users.
Cold Temperature Operation
Cold temperatures slow a battery’s internal chemistry. This slowdown increases the cell’s internal resistance. As a result, the battery cannot deliver energy as efficiently. The discharge curve for a cold battery shows a significantly lower operating voltage and a much-reduced total capacity. A battery at -20°C might deliver only a fraction of the energy it would at a comfortable 25°C.
For users in cold climates, this means devices may shut down unexpectedly even when the battery indicator shows a partial charge.
Avertissement : Never charge a Li-ion battery in sub-zero temperatures (below 0°C or 32°F). Charging a frozen battery can cause permanent plating of metallic lithium on the anode, leading to irreversible damage and serious safety hazards.
To get the best performance in the cold, users should try to keep their devices warm, for example, in an inside pocket close to body heat.
High Temperature Risks
High temperatures create a different set of problems. While heat lowers internal resistance, allowing for high current draws, it drastically accelerates battery aging. Sustained operation above 45°C (113°F) causes unwanted chemical reactions to speed up, permanently degrading the battery’s electrodes. This leads to irreversible capacity loss.
| Operating Temperature | Capacity Loss (after 260 cycles) |
|---|---|
| 25°C (77°F) | ~4% |
| 55°C (131°F) | ~13% |
The most severe risk is emballement thermique. If a battery’s internal temperature becomes too high, often triggered by ambient temperatures above 28°C (82°F), it can enter an uncontrollable, self-heating state. This can result in fire or explosion. Users must avoid leaving battery-powered devices in hot cars or direct sunlight to ensure both longevity and safety.
Achieving Optimal Usage Patterns
Understanding the technical details of a discharge curve is the first step. The next step is using that knowledge to implement Optimal Usage Patterns. This means users can actively make choices that extend battery life and ensure reliable performance. Two key strategies are selecting the correct cell for the task and adopting smart charging habits. Following these Optimal Usage Patterns translates theory into real-world benefits.
Matching Cell Type to Application
Choosing the right battery is like picking the right tool for a job. A battery is not a one-size-fits-all component. Its internal chemistry dictates its performance. Users must match the cell’s strengths to the device’s power demands to achieve Optimal Usage Patterns.
Different chemistries offer unique advantages.
- Oxyde de lithium et de cobalt (LCO) cells have high energy density. They can store a lot of energy in a small space. However, they have low power density, making them unsuitable for high-load tasks. They excel in low-drain devices where long runtime is the priority.
- Oxyde de lithium nickel manganèse cobalt (NMC) cells are very versatile. Manufacturers can design them as ‘Energy Cells’ or ‘Power Cells’. An NMC energy cell might offer a high capacity of 2,800mAh with a moderate 5A discharge. A power-focused version could have a lower 2,000mAh capacity but deliver a powerful 20A continuous current.
- Phosphate de fer lithié (LFP) chemistry provides an exceptionally flat discharge curve. This ensures consistent power. However, this flat curve makes it hard to guess the battery’s remaining charge just by voltage. These cells require advanced Battery Management Systems (BMS) for accurate state-of-charge tracking.
The choice between a ‘Power Cell’ and an ‘Energy Cell’ is critical. Power cells are built for high-current demands. They are perfect for devices needing quick bursts of energy.
Examples include outils électriques, hybrid cars, and high-performance drones. 🏎️
Energy cells, on the other hand, are designed for endurance. They provide steady power over long periods.
Devices like medical heart pumps and electric lawnmowers rely on these cells. ❤️
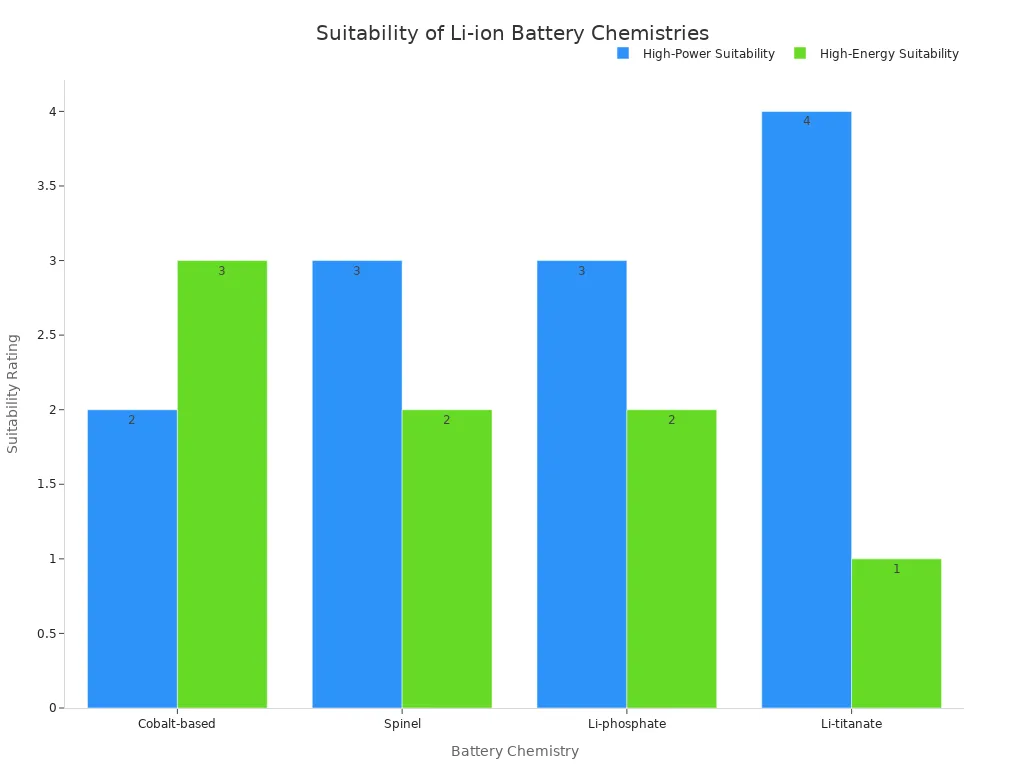
As the chart shows, some chemistries are clear winners for specific tasks. Using the wrong cell type leads to poor performance and a shorter lifespan. This makes matching the cell to the application a cornerstone of Optimal Usage Patterns.
The 20-80% Rule for Longevity
How a user charges a battery directly impacts its long-term health. The “20-80% rule” is a well-known guideline for maximizing battery longevity. This practice involves keeping the battery’s state of charge (SOC) between 20% and 80%. It avoids the stress placed on a cell at very high or very low charge levels.
Charging a Li-ion battery to its absolute maximum (100%) or draining it completely (0%) accelerates degradation. The chemical stress from these extremes causes irreversible capacity loss over time. Limiting the charge range is a simple yet effective strategy.
Pro Tip: Even small reductions in peak charge voltage can have a huge effect. Charging a cell to just 4.1V instead of 4.2V can double its cycle life. Charging to 4.0V can quadruple it. 💡
This is why the 20-80% rule is one of the most effective Optimal Usage Patterns for extending service life. For electric vehicles (EVs), this practice is considered much “kinder” to the battery pack. Modern Battery Management Systems often help by preventing the battery from ever truly reaching 0%, but user habits still play a major role.
While the benefits are clear, some users find it difficult to follow this rule manually. Manually unplugging a device at 80% can be a “huge pain.” Thankfully, many modern devices and EVs now include automated features. These systems allow users to set a charging limit, making it easy to protect their battery’s health without constant monitoring.
A battery’s discharge curve is a powerful visual tool. It translates abstract specifications into predictable, real-world performance. Users directly influence this performance by managing the two most critical factors: the discharge rate (C-rate) and the operating temperature. Understanding these curves is crucial for selecting a battery that precisely matches a device’s needs. This knowledge empowers users to implement strategies that guarantee optimal performance and significantly extend a battery’s service life and reliability. 🔋
FAQ
What is the most important part of a discharge curve?
The stable voltage plateau is the most important part. This long, flat section shows the time a battery provides consistent power. It helps a user understand how long a device will operate reliably before its battery needs recharging.
Can a user put a Power Cell in a smartphone?
A person can use a Power Cell in a smartphone. It is not the best choice. Power Cells have lower capacity (mAh) than Energy Cells. The phone’s runtime will be shorter. An Energy Cell is better for long-lasting performance.
Why should a user avoid charging a battery to 100%?
Charging a battery to 100% puts stress on its internal chemistry. This stress accelerates aging and causes permanent capacity loss. Following the 20-80% rule is a simple way to help the battery last much longer.
Pro Tip: Limiting the charge protects battery health and extends its service life. 💡
Does a higher C-rate mean a better battery?
A higher C-rate is not always better. It is only better for high-power devices like drones or power tools. Low-power devices, like sensors, perform best with low C-rate batteries. The best battery matches the application’s power needs. 🔋