

If you’re sizing a LiPo pack in 2025—whether for a drone, handheld tool, robot, or industrial device—the label’s C‑rating can either be a helpful shortcut or a trap. This guide turns C‑rating into the numbers you actually need: current, runtime, voltage under load, and safe margins.
Quick definition (and the one formula you’ll use)
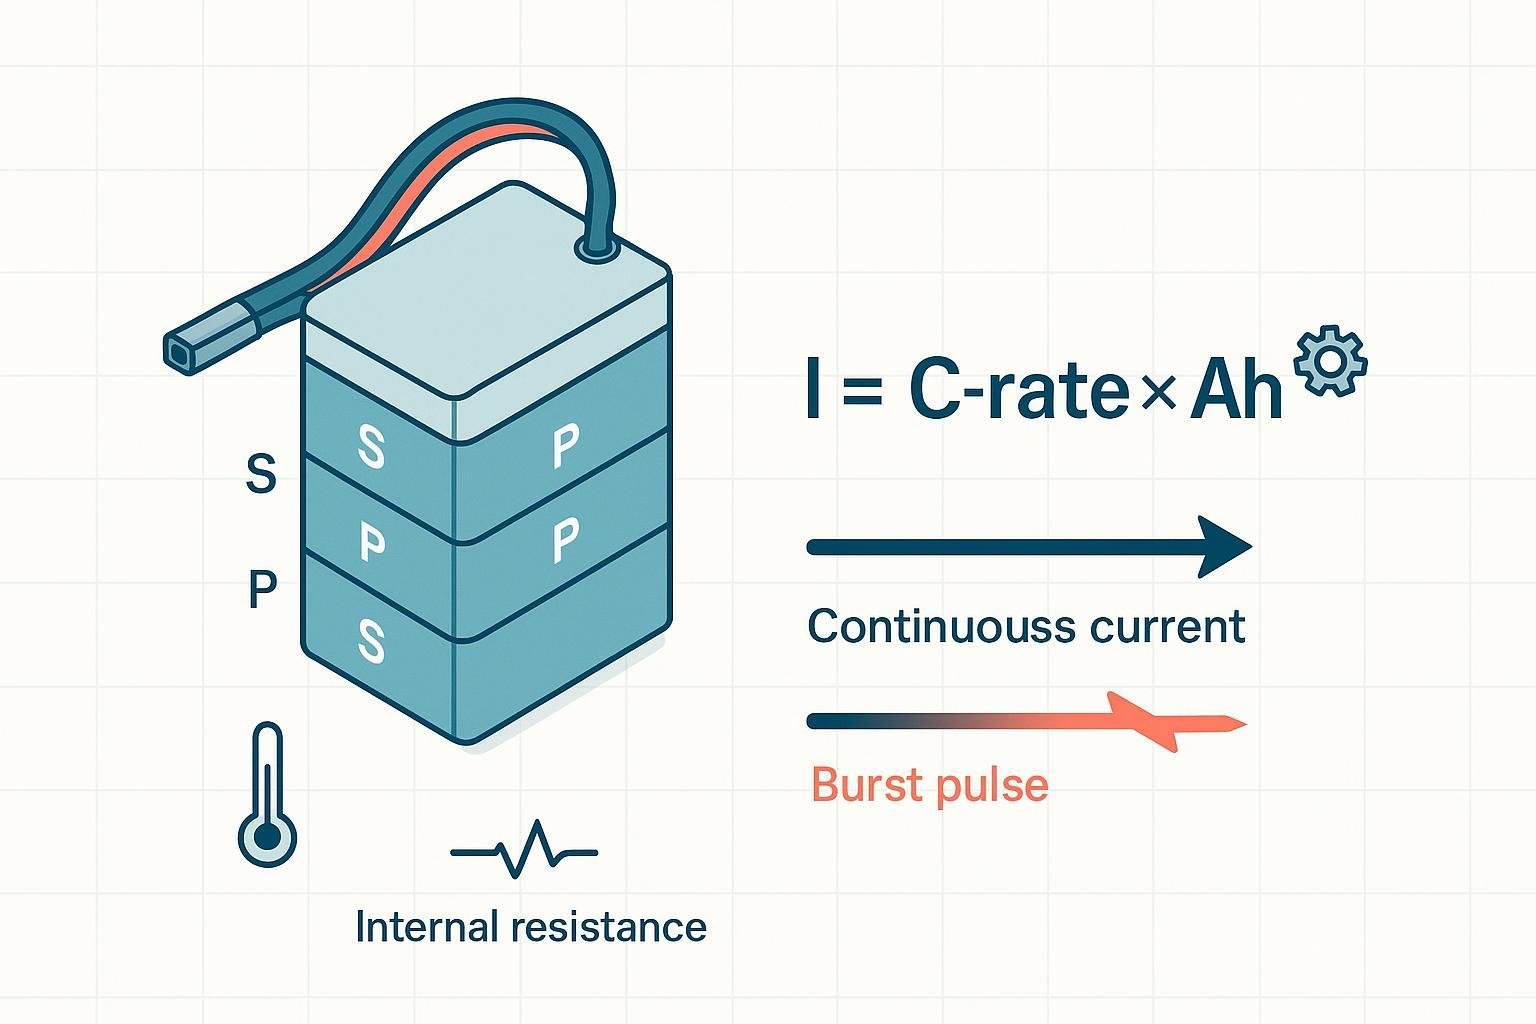
- C‑rating is a unitless multiplier that links discharge current to capacity. The core relation is: I (A) = C_rate × Capacity (Ah).
- 1C ideally means a full discharge in about 1 hour; 0.5C ≈ 2 hours; 2C ≈ 30 minutes (real systems vary due to cutoffs and internal losses). See the plain‑language discussion in Battery University’s BU‑402 — What Is C‑rate? and discharge behavior in BU‑501 — Basics about Discharging.
Think of C‑rate like a gear ratio between current and capacity. A 5 Ah pack at 10C implies 50 A. The number itself doesn’t guarantee safety or temperature—those depend on the cell design, thermal environment, and system limits.
Continuous vs. burst (peak): what the labels really mean
- Continuous C‑rating is the current a pack can sustain without exceeding temperature or voltage limits, typically under lab conditions around 25 °C with reasonable cooling. This is not standardized across brands.
- Burst/peak C‑rating is a higher current allowed for short intervals. The duration is defined by the manufacturer when it’s defined at all; it is not universal.
- Some datasheets explicitly state pulse capability and duration. For example, the Energus Li8P25RT lists multiple short discharge pulses (e.g., 360 A for 5 s; 240 A for 6 s) with specified rest periods and cutoffs in its Energus Li8P25RT datasheet, rev. K (PDF).
- High‑power Li‑ion cells like Molicel P45B publish 10‑second power figures by state of charge (e.g., 184 W for 10 s at 90% SOC) in the Molicel INR21700 P45B product datasheet (v1.2, PDF).
- Practical takeaway: if a “burst” duration isn’t stated, assume only a few seconds and validate through your own testing. Repeated bursts can add up thermally and effectively become a continuous load.
How series/parallel change current, voltage, and C‑rate
- Series (S) adds voltage; capacity in Ah stays the same as one parallel string; the allowable current per string follows the same C‑rate.
- Parallel (P) adds capacity; at the same C‑rate the pack’s allowable current scales with the number of cells in parallel.
- For a short overview with examples, see Battery University BU‑302 — Series and Parallel Configurations.
In other words, a 6S1P pack has the same Ah as one cell but 6× the voltage. A 6S2P doubles the Ah and therefore doubles the allowable current at a given C‑rate (assuming identical cells and good thermal coupling).
A practical sizing workflow (with margins engineers actually use)
- Capture the load profile: continuous current, peak current, peak duration, duty cycle, ambient temperature, and airflow.
- Convert power to current when needed: I = P / V_pack. Use a realistic under‑load voltage, such as ≈3.5 V per Li‑ion cell for sustained draw, rather than the 3.7 V nominal.
- Choose capacity for runtime: Ah ≈ I_avg × runtime (hours).
- Compute required C‑rates from capacity: C_cont_req = I_cont / Ah; C_peak_req = I_peak / Ah.
- Apply safety margins to account for temperature, aging, and optimistic marketing:
- Continuous: multiply by about 1.5–2.0.
- Burst: multiply by about 2.0–3.0 unless the datasheet clearly specifies and you validate in test.
- Check thermal limits and voltage sag: plan to keep pack surfaces in sustained use roughly below 45–50 °C for longevity, and ensure voltage stays above your end‑of‑discharge under load. Temperature’s impact on safety and aging is discussed in Battery University BU‑304b — Making Lithium‑ion Safe.
- Verify the whole current path: BMS limits, fuses, wire gauge, connector ratings, and cell matching may bottleneck current before the cells do.
Why margins matter: internal resistance drives heat (I²R) and voltage sag; both worsen at low temperature and with aging. The standard industry way to characterize power capability versus state of charge is HPPC pulse testing, as laid out in the INL FreedomCAR Battery Test Manual, HPPC method (2003, PDF) and further detailed in the PNGV Battery Test Manual Rev. 3 (INL, PDF).
Temperature, internal resistance, and aging: how they derate your C‑rate
- DC internal resistance (DCIR) causes immediate voltage drop under load and heat proportional to I²R.
- Cold increases DCIR → bigger sag → earlier cutoff; hot can reduce resistance but accelerates degradation. DOE testing summaries highlight controlling environment and thermal limits during high‑rate operation; see the DOE Energy Storage testing and design overview (2014, PDF).
- Aging increases DCIR and reduces usable power at a given C‑rate. Re‑test power capability after cycling (e.g., mid‑life) to recalibrate margins, using HPPC‑style pulses per the INL FreedomCAR HPPC method (2003, PDF).
Practical tips:
- Validate at the coldest and hottest expected ambients for your device.
- Log pack temperature, current, and voltage on first prototypes; derate until you’re below thermal targets with headroom.
End‑of‑discharge (EOD) voltage and voltage sag
- Many high‑rate Li‑ion cells specify a discharge cutoff around 2.5 V per cell in datasheets (cell‑level). For example, see the 2.5 V cutoff in the Molicel INR21700 P42A datasheet, rev. V4 (PDF) and the P45B sheet noted above.
- For pack‑level operation and longevity, designers often set higher under‑load cutoffs (≈3.0 V/cell) to avoid deep depletion and excessive sag; general discharge guidance is summarized in Battery University BU‑501 — Basics about Discharging.
Rule of thumb: use your under‑load cutoff (e.g., 3.0–3.2 V/cell at the ESC/BMS) when doing runtime math, not the nominal voltage.
Standards context (why C‑rating isn’t verified by IEC/UL)
- Performance measurement for portable Li‑ion cells (capacity declarations and some test conditions) is defined in IEC 61960‑3:2017, performance of prismatic and cylindrical cells. This standard does not certify a marketer’s “60C” or “100C” label.
- Safety certifications such as IEC 62133‑2 — safety requirements for lithium systems and UL standards referenced in UL’s Battery Safety Testing overview (UL 1642, UL 2054) evaluate safety, abuse, and protection—not high discharge C‑rating claims.
Implication for 2025 buyers: treat C‑ratings as manufacturer specifications, verify with your own qualification testing, and rely on reputable vendors with complete datasheets.
What C‑rating is — and is not
- Is: a normalized rate linking current to capacity (I = C × Ah).
- Is not: a guarantee of thermal safety, a measure of energy capacity, or equivalent to “cold cranking amps” (CCA). It does not, by itself, account for temperature, aging, or voltage sag.
Worked examples (with 2025‑relevant scenarios)
Example A — 6S drone pack with burst demands
- Requirement: 900 W peak for 5 s; 400 W cruise; 6S pack. Nominal 6S is 22.2 V, but assume ≈20.5 V under load.
- Current: I_peak ≈ 900 / 20.5 ≈ 44 A; I_cont ≈ 400 / 20.5 ≈ 19.5 A.
- Runtime target: 15 minutes of cruise ⇒ 0.25 h. Capacity ≈ 19.5 A × 0.25 h ≈ 4.9 Ah.
- Required C (no margin): C_cont_req ≈ 19.5/4.9 ≈ 4C; C_peak_req ≈ 44/4.9 ≈ 9C.
- With margin (×2 continuous, ×2 burst as a starting point): pick a pack marketed around ≥8C continuous and ≥18C burst. In hobby markets where labels are optimistic, this often maps to packs advertised near 20–30C—verify by temperature logging and a short pulse test.
- Note: For explicit pulse durations to compare against, review examples like the Energus Li8P25RT pulse table (rev. K, PDF) and 10‑s power in the Molicel P45B datasheet (PDF).
Example B — Industrial handheld (continuous draw)
- Load: 8 A continuous; 3S pack; desired runtime 2 h.
- Capacity: Ah ≈ 8 A × 2 h = 16 Ah.
- Required C (no margin): C_cont_req ≈ 8/16 = 0.5C.
- Selection: a pack with a genuine 1C continuous capability provides comfortable headroom. Prioritize energy‑optimized cells for longer cycle life and keep surfaces below roughly 45–50 °C per conservative practice (see temperature discussion in BU‑304b).
Example C — Marketing sanity check on “100C” labels
- A 5 Ah pack labeled “100C continuous” implies 500 A continuous. That is practically unrealistic for small LiPo packs; even high‑power cylindrical cells listing 45 A max continuous at ~4–4.5 Ah capacity (≈10C) do so with significant thermal management, as seen in the Molicel INR21700 P42A datasheet (rev. V4, PDF). Treat extreme labels as marketing unless validated by your own tests.
Common pitfalls and red flags
- Treating burst like continuous. Repeated “short bursts” with little cooling interval can equal a continuous thermal load.
- Ignoring temperature. Cold sags voltage; hot accelerates aging. Always test at temperature extremes.
- Overlooking system bottlenecks. BMS trip limits, connector/wire ratings, and fuses often cap current before cells do.
- Using nominal voltage for power math. Use under‑load voltage for more realistic current estimates.
- Believing C‑labels are certified. They aren’t; compare datasheets and validate. The capacity test conditions are standardized in IEC 61960‑3:2017, but discharge C‑ratings are not verified by IEC/UL.
Quick checklist you can copy into your spec
- Load profile captured: I_cont, I_peak, duration, duty, ambient, airflow.
- Power converted to current using under‑load V (≈3.5 V/cell for sustained draw).
- Capacity sized for runtime; C_req computed for continuous and peak.
- Margins applied: ×1.5–2 (continuous), ×2–3 (burst) unless datasheet specifies and testing confirms.
- Thermal plan: keep sustained case temps roughly < 45–50 °C; add heatsinking/airflow if needed.
- EOD and cutoff set: ≈3.0–3.2 V/cell under load for longevity; verify cell‑level cutoff (e.g., 2.5 V) in the datasheet.
- Compliance context noted: IEC 61960‑3 for capacity; IEC 62133‑2/UL focus on safety, not C‑ratings.
- Validation plan: HPPC‑style pulse tests, temperature logging, and retest after aging.
Bottom line: C‑rating is a convenient shorthand, not a guarantee. Turn it into amps with I = C × Ah, add realistic margins for temperature and aging, and validate with short pulse tests and temperature monitoring. That’s how you get reliable performance in 2025 devices without surprises.