

If you work with lithium polymer (LiPo) batteries—whether you fly FPV, build consumer devices, maintain field gear, or run incoming QC—knowing how to test health accurately is the difference between safe, reliable power and expensive (or dangerous) failures. This guide distills current (2025) best practices into practical SOPs you can run at home, in a makerspace, or on a professional bench. We’ll focus on common Li-ion polymer chemistries used in “LiPo” packs (e.g., NMC/NCA at nominal 3.6–3.7 V per cell), not LiFePO4, which has different voltages and behaviors.
What you’ll get: step-by-step procedures, decision trees, realistic thresholds, and references to authoritative sources and standards. Keep this open next to your charger or electronic load.
Read This First: Safety and Quick Triage
You don’t need lab gear to avoid the biggest hazards. Start every session with triage. If any of the following are true, stop and isolate the battery in a nonflammable container:
- The pack is swollen/puffy, smells sweet/solvent-like, hisses, or feels hot after rest.
- Physical damage: dents, punctures, torn pouch, crushed corners, wet contamination.
- Electrical anomalies: sudden voltage drop, large persistent cell imbalance, or a BMS fault.
Fire response and containment
- If a device or pack ignites, knock down visible flames with halon/clean agent if available, then cool aggressively with water to stop thermal runaway propagation; monitor for re-ignition. This cooling-first principle is emphasized in the FAA Fire Safety program materials that echo SAFO guidance (2009 and later) — see the FAA’s technical briefing slide deck on UL 5800 systems within the FAA Fire Safety repository: FAA Fire Safety guidance on Li‑ion event response.
- NFPA public safety guidance also stresses cooling with water/nonalcoholic liquids and continued monitoring for reignition; review the NFPA lithium‑ion battery safety tip sheet.
Disposal/recycling of damaged packs
- Never toss LiPo in the trash or curbside recycling. In the U.S., lithium-ion batteries are commonly managed as universal waste; tape terminals, bag individually, and send to qualified recyclers per EPA guidance in the EPA lithium‑ion battery recycling FAQ.
- For swollen, damaged, or suspect packs, use a DOT-permitted DDR kit from Call2Recycle; their DDR pail program for damaged/defective/recalled Li‑ion includes packaging and instructions.
Quick triage checklist (before any test)
- Visual: no swelling, punctures, burns, or leakage
- Smell/sound: no solvent odor, sizzling, hissing
- Temperature: within room range, cool to the touch after rest
- Voltage sanity: each cell roughly 3.5–4.2 V; no single cell >0.10 V off peers at rest
- Leads/connectors: intact, no melted housings or exposed conductors
- Environment: nonflammable surface, fire extinguisher and water source on hand, no unattended charging
If it fails triage: isolate, do not test, and arrange compliant recycling.
LiPo Health 101 (SoC, SoH, OCV, IR, Capacity)
- State of Charge (SoC): How full the cell is right now. Open-circuit voltage (OCV) tracks SoC after the cell has rested, but the OCV–SOC curve is flat across the mid-range, so small voltage changes can reflect big SoC swings.
- State of Health (SoH): Long-term condition (capacity retention, resistance growth, self-discharge). You’ll gauge SoH primarily by measured capacity and internal resistance trends.
- Capacity: Measured in Ah/Wh by a controlled discharge after a standard charge. Capacity declines with cycle life and calendar aging.
- Internal Resistance (IR): The effective resistance inside the cell that causes voltage sag under load and heat generation. Measured by AC (often 1 kHz) or DC pulse methods; it increases with aging and abuse.
- Rest and temperature matter: Take OCV and IR readings at consistent temperature (20–25°C) and after rest, otherwise your numbers will jump around. TI’s fuel-gauge documentation explains why gauges wait for a relaxation period before sampling OCV for accurate estimation; see TI fuel‑gauge OCV relaxation guidance.
Standard test conditions in manufacturer datasheets generally align with IEC 61960 practices: CC/CV charge at 0.5C to 4.2 V with an end-of-charge taper to 0.05C, followed by discharge at a set C‑rate and temperature. For example, Panasonic’s NCR18650B datasheet specifies CC‑CV to 4.20 V with a 0.5C standard current at ~25°C; review the Panasonic NCR18650B standard test conditions. Murata (Sony) similarly documents standard charge/discharge parameters for the US18650VTC6 cell; see Murata US18650VTC6 datasheet standard charge/discharge.
Tools You’ll Need in 2025 (good/better/best)
You can test LiPo health with anything from a smart hobby charger to a PC‑connected analyzer and electronic load. Choose a toolchain that matches your accuracy needs and budget.
-
Good (budget analyzers)
- ZKE Tech EBC/EBD series: low‑cost programmable loads and USB analyzers for capacity tests and basic IR. Check the ZKE Tech EBC/EBD product line page.
-
Better (PC analyzer)
- West Mountain Radio CBA V: established USB analyzer with robust software for discharge curves and capacity; see the West Mountain Radio CBA V analyzer.
-
Hobby smart chargers (convenient all‑in‑one)
- Modern chargers often read IR and log via app/USB. As examples, see the ISDT K‑series smart chargers. Treat built‑in IR readings as relative, not absolute; use the same charger and conditions over time to trend a pack.
-
Pro tip: For low milliohm IR, use 4‑wire (Kelvin) connections to avoid lead/contact resistance errors. Hioki’s primer explains why Kelvin connections are essential for accurate internal resistance testing; see Hioki’s internal resistance measurement basics.
SOP: 0.5C Capacity Test (step‑by‑step)
Goal: Measure usable capacity (Ah and Wh) under controlled, repeatable conditions.
Test conditions
- Temperature: 20–25°C, minimal drafts; log ambient temp
- Cell/Packs: undamaged, balanced, passed triage
- Fixture: low‑resistance wiring; appropriate connector; pack secured on nonflammable surface
- Instrument: analyzer or charger with discharge logging
Procedure
- Inspect and prepare
- Verify no swelling, damage, or leakage; confirm leads/connectors are secure.
- If a multi‑cell pack, run a balance charge first so starting SoC is even across cells.
- Standard charge
- CC to 4.20 V/cell at 0.5C (e.g., 2 A for a 4 Ah cell), then CV hold until current tapers to ~0.05C. This mirrors common manufacturer standards such as the Panasonic NCR18650B charge profile.
- Rest
- Let the battery rest 30–60 minutes at 20–25°C to reach near‑equilibrium OCV.
- Discharge
- Set a constant current discharge at 0.5C.
- Cutoff voltage: For field testing, use ~3.0–3.2 V per cell to avoid deep discharge stress. For lab comparison per datasheets, follow the maker’s specified cutoff (often 2.5–3.0 V for cylindrical NMC/NCA cells; see Murata VTC6 standard discharge parameters).
- Log and compute
- Record discharged Ah and Wh. Save the voltage vs. time (or SOC) curve for future comparisons.
- Interpret
- Compare measured capacity to the pack’s rated capacity at similar conditions.
- Many programs consider end‑of‑life at about 80% of rated capacity; see the U.S. DOE’s practice citing an 80% capacity EoL criterion (2014) and NREL’s second‑life screening that also uses an ≈80% capacity threshold (2022).
Common pitfalls
- Temperature drift: capacity rises with warmth; keep 20–25°C.
- Rest skipped: immediate discharge after charge inflates readings due to surface charge.
- Cutoff mismatch: comparing 3.2 V vs 2.5 V cutoffs will change the measured capacity.
- Loose/long leads: voltage drop in wires spoils curve; keep connections short and solid.
Template: capacity test log (copy/paste)
- Battery ID:
- Cells x S:
- Rated capacity (Ah/Wh):
- Instrument/model/firmware:
- Ambient temp (°C):
- Charge method (I, V, taper, time):
- Rest time (min):
- Discharge current (A, C):
- Cutoff (V/cell):
- Measured Ah:
- Measured Wh:
- Notes (curve shape, sag, anomalies):
SOP: Internal Resistance (IR) Measurement
You’ll use two complementary methods: quick AC (often 1 kHz) for trending, and DC pulse for performance‑relevant sag.
Test conditions
- Temperature: 20–25°C, log it
- SoC: mid‑range (~40–60% SoC) to avoid edge‑of‑curve effects
- Connections: prefer 4‑wire Kelvin wherever possible; clean contacts
A) AC IR at 1 kHz (fast trending)
- Rest the battery 30–60 minutes at 20–25°C.
- Using an LCR/IR meter or a charger with IR readout, measure internal resistance at or near 1 kHz.
- Repeat 3 times and average.
- Track IR over time using the same instrument and setup. For background on AC IR and Kelvin, review Hioki’s internal resistance measurement basics.
B) DC pulse IR (sag under load)
- Bring the battery to ~50% SoC and 20–25°C; rest 30 minutes.
- Set up an electronic load or programmable analyzer to apply a short current pulse (e.g., 1–3 seconds at ~1C). Keep the pulse brief to limit heating.
- Sample voltage just before the pulse and at the end of the initial step response (e.g., 100–200 ms into the pulse) to capture the ohmic drop.
- Compute DCIR = ΔV / ΔI. Repeat 3 times and average.
- Optionally, run pulses at multiple currents (0.5C, 1C, 2C) to profile dynamic sag vs load. Tektronix’s battery testing materials discuss temperature/SOC dependence and dynamic behavior relevant to pulse testing; see Tektronix on simulating and testing batteries.
Interpretation
- Trend vs. baseline when new. A practical retirement flag is when DCIR grows to roughly 1.5–2× its initial value, or when sag under your typical load causes performance or thermal issues. There is no universal standard threshold—judge against your application’s current demands.
Pitfalls to avoid
- Mixed instruments: AC IR numbers from different chargers/meters aren’t directly comparable.
- Contact resistance: banana clips and oxidized bullets add milliohms; use Kelvin clips and clean metal.
- SoC/temperature drift: measure at consistent SoC and temperature.
SOP: Self‑Discharge (Leakage) Check
Goal: Detect abnormal internal leakage (soft shorts) that cause voltage and capacity to drop while idle.
Procedure (practical 1–4 week check)
- Standard charge to full (CC/CV), then rest 1–2 hours at 25°C; record OCV.
- Option A (full‑SOC leak check): Store at ~25°C for 1–2 weeks; re‑measure OCV weekly. Optional: perform a capacity test at the end and compare.
- Option B (storage‑SOC check): Discharge/charge to ~3.8 V per cell (typical storage level), rest 1–2 hours, record OCV. Store 2–4 weeks at ~25°C, logging OCV weekly.
- Interpretation: Healthy cells show small, gradual OCV drift once relaxation is complete. Significant, continuing voltage drop or capacity loss over weeks suggests abnormal self‑discharge. For background on calendar aging and self‑discharge considerations, see NREL’s BLAST calendar‑aging modeling resources.
Optional Bench Diagnostics (advanced but useful)
- Load/voltage‑sag profiling: Step through multiple current levels (e.g., 0.5C, 1C, 2C) at a given SoC and temperature; compute dynamic resistance at each step. This gives a performance picture that correlates well with DCIR. Tektronix’s application content provides context on dynamic behavior; see Tektronix automotive/EV battery testing overview.
- OCV–SOC mapping: For a specific cell type, generate your own OCV table by measuring OCV after long rests (≥3–24 h) at various SoC points at 25°C. TI fuel‑gauge literature explains relaxation sampling and how gauges update capacity models based on OCV; start with TI fuel‑gauge OCV and relaxation notes.
- EIS (electrochemical impedance spectroscopy): Separates ohmic, charge‑transfer, and diffusion elements and can reveal degradation modes. Useful for R&D and failure analysis; requires specialized equipment and training. Not needed for routine field checks.
Interpreting Results: Thresholds and Decision Tree
Capacidad
- Pass: ≥90–100% of rated capacity under your chosen conditions
- Watch: 80–90% and/or declining rapidly over cycles
- Retire/secondary use: ≤80% of rated capacity (commonly used end‑of‑life criterion in research and second‑life screening; see DOE’s 80% capacity EoL practice (2014) and NREL’s ≈80% threshold in second‑life procedures (2022)).
Internal resistance (IR)
- Pass: similar to baseline when new; low sag, low heat under typical load
- Watch: ~1.25–1.5× baseline, or sag beginning to limit performance
- Retire: ~1.5–2× baseline, or thermal rise/sag unacceptable at operating currents
Cell balance (multi‑cell packs)
- Pass: ≤0.03–0.05 V cell delta after charge/rest
- Watch: 0.05–0.10 V persistent delta; investigate connections and cell health
- Retire: >0.10 V persistent or worsening delta; likely a weak/leaky cell
Damage and safety
- Any swelling, puncture, leakage, burnt odor, or abnormal heating → Do not charge or use; isolate and recycle via a DDR pathway as described by the EPA’s lithium‑ion battery pages.
Decision tree: keep, monitor, or retire
- If pack passes triage and:
- Capacity ≥90% AND IR ≤1.25× baseline AND cell delta ≤0.05 V → KEEP in service. Re‑test in 3–6 months.
- Capacity 80–90% OR IR ~1.25–1.5× baseline OR cell delta 0.05–0.10 V → MONITOR. Reduce peak loads; shorten duty cycles; re‑test in 1–3 months.
- Capacity ≤80% OR IR ≥1.5–2× baseline OR persistent cell delta >0.10 V → RETIRE from demanding use. Consider secondary/low‑load use or recycle.
- At any point, if the pack shows swelling, damage, leakage, or abnormal heating → ISOLATE AND RECYCLE (DDR kit if needed).
Maintenance and Storage Best Practices (to prolong health)
- Storage voltage: Keep between ~3.70 and 3.85 V per cell for storage beyond several days. Avoid leaving at 4.2 V for long periods—calendar aging is faster at high SoC.
- Temperature: Store and test around 20–25°C when possible. Avoid hot cars and freezing garages.
- Cycling: Moderate depth‑of‑discharge (20–80% SoC) is gentler than full swings.
- Charging rate: 0.5–1C is a reasonable range for health; follow the cell/pack’s datasheet limits.
- Balance regularly: For multi‑cell packs, run a balance charge every few cycles to keep cells aligned.
- Handling: Don’t crush, bend, or twist pouch packs. Support and strain‑relieve leads.
- Never leave charging unattended; use a nonflammable surface and have water/extinguisher nearby, in line with the safety emphasis found in NFPA lithium‑ion consumer tips.
Compliance, Shipping, and Standards (know the landscape)
- Safety standard for portable lithium systems: IEC 62133‑2 governs key safety requirements and testing for sealed secondary lithium systems; see the IEC 62133‑2:2017 + A1:2021 publication overview.
- North American safety standards: UL 1642 (cell level) and UL 2054 (pack level) cover safety tests like crush, overcharge, and short circuit; see UL 1642 overview y UL 2054 overview.
- Transport testing: UN 38.3 (T.1–T.8) is required before lithium cells/packs can be shipped. Familiarize yourself with the UN 38.3 test series in the UN Manual of Tests and Criteria. U.S. shippers should also consult PHMSA’s current guidance; see the PHMSA Lithium Battery Guide (2024).
These references are not “how to” testing manuals for hobbyists, but they anchor the safety envelope your procedures must respect.
Field‑Friendly Quick Checks (when you don’t have a lab)
- Charger IR trend: Use the same smart charger to read IR at room temp and mid‑SoC; log numbers over time. Treat them as relative, not absolute.
- Voltage under load: At a typical current, note the sag vs. earlier sessions. More sag at the same current = aging or low temperature.
- Rested OCV spot‑check: After a 30–60 min rest at room temp, 3.75–3.85 V per cell typically indicates mid‑SoC for NMC‑like chemistries. Large drift over a week at rest points to leakage.
- Heat feel check: If it runs noticeably hotter than before at the same duty, IR has likely risen—time for a formal test.
Common Failure Patterns and What They Mean
- High IR but decent capacity: Cell/packs can still deliver energy slowly but struggle at high current. Good for light‑load secondary use.
- Normal IR but low capacity: Often calendar‑aged from long high‑SoC storage or deep discharge wear. Retire for critical use if ≤80% capacity.
- One weak cell (imbalance grows): The outlier likely has higher leakage or internal damage. Packs are only as strong as their weakest cell.
- Rapid self‑discharge at rest: Internal micro‑shorts or contamination. Isolate and recycle.
- Puffing/swelling: Gas generation from electrolyte breakdown—danger. Stop, isolate, and use compliant DDR disposal.
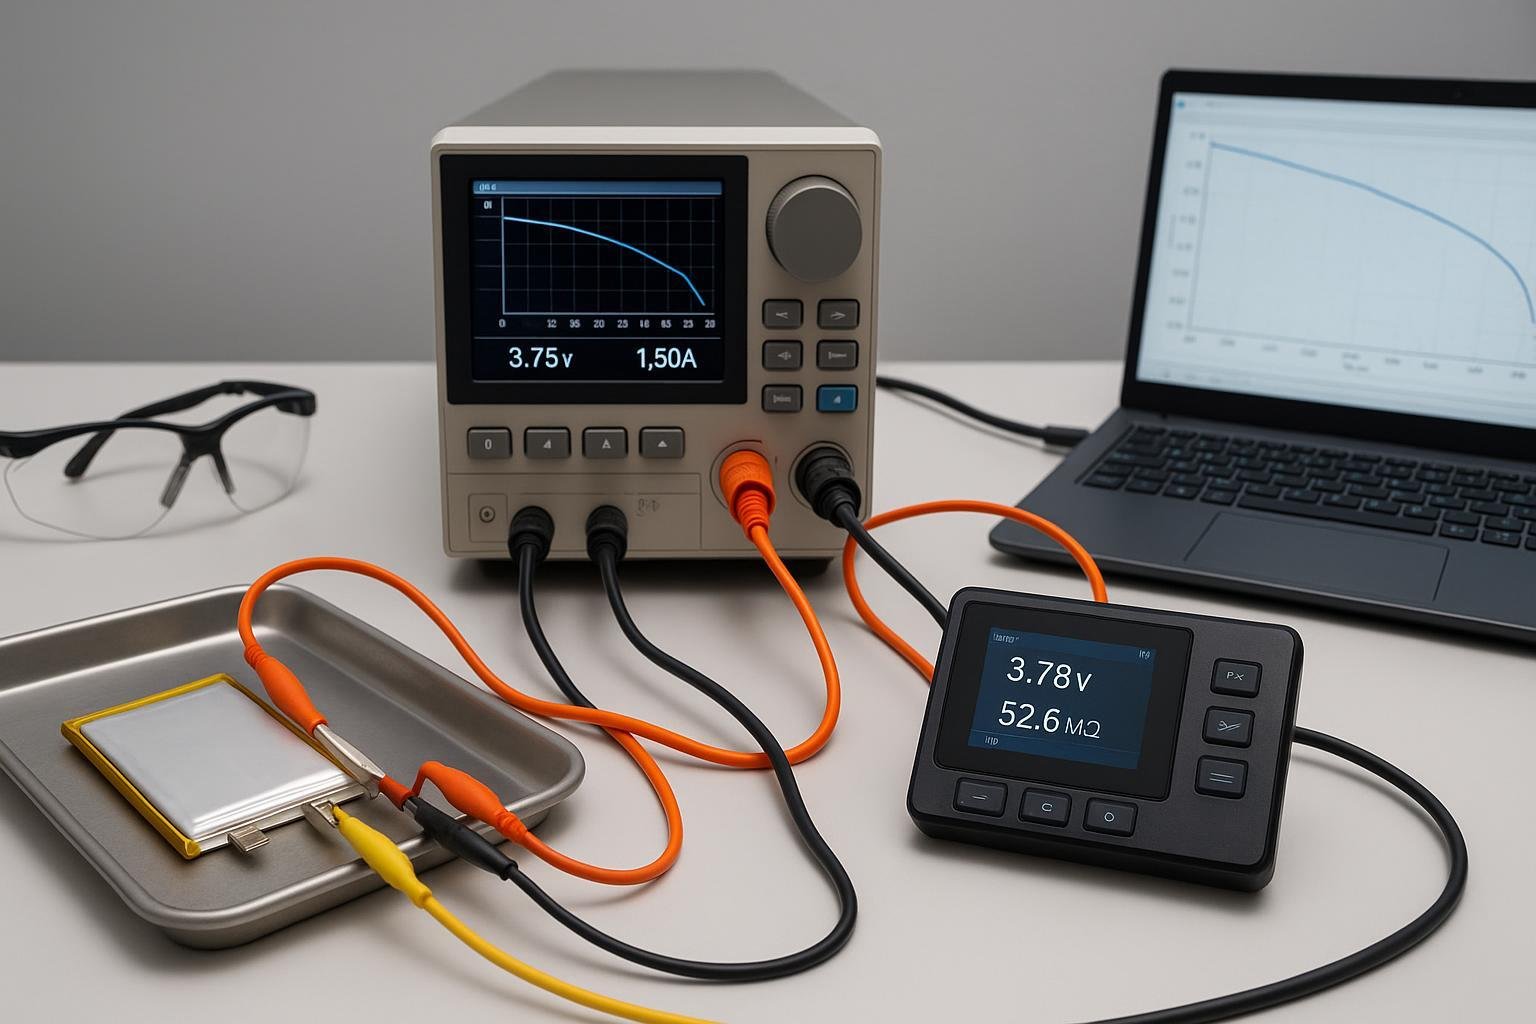
Example: A Repeatable Bench Setup
- Bench: Steel tray or ceramic tile, away from combustibles
- Tools: PC analyzer (e.g., West Mountain Radio CBA V) or a ZKE Tech EBC series load plus a smart charger
- Wiring: 12–14 AWG silicone wire for high currents; use Kelvin clips for IR where possible (see Hioki Kelvin guidance)
- Environment: 22–23°C room, fan off, thermometer visible
- Protocol: Balance → Standard charge → Rest 45 min → Capacity test at 0.5C to defined cutoff → IR tests at ~50% SoC → Log all results
Printable Checklists and Templates
Health check quick list
- [ ] Passed safety triage (no swelling/damage/leaks/odor/heat)
- [ ] Ambient 20–25°C; fire response plan; water source
- [ ] Balanced (for multi‑cell packs)
- [ ] Standard charge complete; rest ≥30 min
- [ ] Instrument and leads verified; Kelvin where applicable
Capacity test notes
- [ ] Discharge at 0.5C
- [ ] Cutoff voltage defined (field vs datasheet)
- [ ] Ah and Wh recorded; curve saved
- [ ] Ambient temperature logged
IR test notes
- [ ] SoC ~50%; rest ≥30 min
- [ ] AC IR at 1 kHz averaged over 3 reads
- [ ] DC pulse at ~1C for 1–3 s; ΔV/ΔI computed
- [ ] Use the same instrument as prior sessions for trending
Self‑discharge check
- [ ] OCV recorded after relaxation
- [ ] Storage temp ~25°C; duration noted
- [ ] Weekly OCV logged; any capacity re‑test annotated
Investigation triggers
- [ ] Capacity ≤80% of rated
- [ ] IR ≥1.5–2× baseline
- [ ] Cell delta >0.10 V persistent
- [ ] Any safety abnormality
Frequently Asked Questions
Q: What cutoff voltage should I use?
- For comparability with datasheets, follow the manufacturer’s stated cutoff (often 2.5–3.0 V/cell for many NMC/NCA cells; see Murata VTC6 datasheet parameters). For routine field health checks, a conservative 3.0–3.2 V/cell reduces deep‑discharge stress.
Q: My charger’s IR reads differently than my meter. Which is right?
- They’re both “right” for their own method. Use the same device and conditions to trend your packs. For accurate low‑ohm measurements, use Kelvin connections as explained in Hioki’s primer.
Q: How long should I rest before reading OCV?
- Practically, 30–60 minutes at 20–25°C yields consistent results. Fuel‑gauge designers discuss entering relaxation and sampling OCV after current falls below a threshold; see TI’s OCV relaxation notes.
Q: When should I retire a pack?
- If capacity is ≤80% of rated or DCIR is ~1.5–2× baseline—or if the pack fails triage visually—retire or relegate to low‑load use. The 80% capacity threshold is widely used in research and second‑life work (DOE 2014; NREL 2022): 80% capacity EoL practice, NREL ~80% second‑life threshold.
Appendix: Reference Standards and Safety Resources
- IEC portable lithium safety: IEC 62133‑2:2017 + A1:2021 overview
- UL cells/packs safety: UL 1642 overview, UL 2054 overview
- UN transport tests: UN 38.3 test series manual; U.S. shipping guide: PHMSA Lithium Battery Guide (2024)
- Fire response principles: FAA Fire Safety briefing on Li‑ion events; NFPA lithium‑ion safety tips
- Disposal/recycling: EPA lithium‑ion battery recycling FAQ; DDR packaging: Call2Recycle DDR pail
- Measurement and modeling: Hioki internal resistance measurement basics; Tektronix battery simulation/testing; TI OCV relaxation note; NREL BLAST overview
- Manufacturer standard test conditions examples: Panasonic NCR18650B datasheet; Murata US18650VTC6 datasheet
Final Notes
- Always defer to the pack manufacturer’s datasheet for absolute limits (charge voltage/current, temperature, cutoff). Standards such as IEC 62133‑2 and UL 1642/2054 define safety envelopes but not your day‑to‑day hobby procedures.
- Document everything. Even simple logs make trend analysis easy and keep you honest about when to retire packs.
- Safety is not optional. Set up your bench so a failure is boring, not catastrophic.