


Li-ion discharge data and voltage patterns provide clear insight into battery health. Proper monitoring of these patterns can extend the average lifespan of lithium-ion batteries by up to 38%, as recent studies in Nature Energy (2025) show. Regular tracking offers users real benefits, including longer battery life, cost savings, and greater device reliability.
- Accurate measurement of each cell’s state of charge ensures optimal performance.
- Monitoring helps detect imbalances or faults early, preventing capacity loss.
- Continuous voltage checks support safe and reliable operation.
Understanding discharge curves gives users the power to maintain and improve battery health with simple steps.
Discharge Data and Battery Health
Why Discharge Data Matters
Discharge data gives a clear picture of how a lithium-ion battery works over time. When a battery powers a device, its voltage drops in a pattern called a discharge curve. Scientists have found that these voltage patterns can reveal important details about battery health. For example, a peer-reviewed study showed that features from discharge voltage curves, like the slope and shape, help estimate the state of health (SOH) of a battery. This method uses real data from experiments and works well for tracking battery aging.
Consejo: Regularly checking discharge data helps users spot problems early and avoid sudden battery failures.
Researchers have developed new ways to use discharge data for battery health assessment. They look at how voltage, current, temperature, and time change during each cycle. By studying these changes, they can predict how long a battery will last and when it might need replacing. Advanced models, tested with data from NASA and Oxford, have reached up to 99% accuracy in predicting battery life. This makes discharge data a powerful tool for anyone who wants to keep their devices running longer.
Battery Health Indicators
Certain signs in discharge data show how healthy a battery is. The most reliable indicators include the constant current charging time and the rate at which the battery’s voltage changes during use. These two factors have the strongest link to battery capacity loss and overall battery health. When the charging time under constant current gets shorter, or the voltage drops faster than normal, the battery may be aging.
Other important indicators come from electrochemical parameters. These include internal resistance, anode impedance, and the thickness of active materials inside the cell. Changes in these values often point to problems like loss of active material or buildup on the battery’s electrodes. By watching these indicators, users can better understand battery health and take steps to extend battery life.
Understanding Discharge Curves

What Is a Discharge Curve
A discharge curve shows how a battery’s voltage changes as it releases energy. Scientists plot this curve by measuring voltage against the amount of energy, or capacity, that the battery has delivered. The curve helps people see how the battery performs during use.
- A typical Li-ion discharge curve appears as a line on a graph, with voltage on the y-axis and discharged capacity on the x-axis.
- A flatter discharge curve means the battery keeps a steady voltage while it works. This is usually a sign of good performance.
- Different types of batteries, like LFP (Lithium Iron Phosphate) and NMC (Nickel Manganese Cobalt), have different curve shapes. LFP cells often show a flatter curve than NMC cells.
- The curve can change if the battery is used quickly or slowly. Lower discharge rates let the battery deliver more energy.
- Temperature also affects the curve. Cold or hot conditions can change how the voltage drops.
- The battery stops working when it reaches its cut-off voltage. This point marks the end of the usable discharge.
Nota: A flatter discharge curve can limit how much energy you use from the battery. The device may shut off when just one cell reaches its lower voltage limit.
Voltage Patterns Explained
Voltage patterns in a discharge curve tell a story about the battery’s health. In a healthy battery, the voltage drops slowly and steadily as the battery discharges. The curve looks smooth and even. If the battery ages or gets damaged, the voltage may drop faster or show sudden dips.
Scientists use these patterns to spot problems. For example, a rapid voltage drop near the end of the curve can mean the battery has lost capacity. A bumpy or uneven curve may signal internal issues, like increased resistance or chemical changes inside the cell.
People can use these patterns to check battery health at home. By comparing the voltage curve from a new battery to one from an older battery, they can see if the battery still works well. This simple check helps users decide when to replace a battery or change how they use it.
Interpreting Discharge Curves
Healthy vs. Degraded Curves
A healthy lithium-ion battery shows a steady and predictable discharge curve. At the start of discharge, the voltage stays almost flat, forming a plateau. This plateau means the battery delivers energy at a stable voltage. As the battery continues to discharge, the voltage slowly drops. Near the end, the voltage falls quickly, signaling the battery is almost empty.
Degraded batteries behave differently. As batteries age, their internal resistance increases. This change causes the voltage to drop faster, especially near the end of discharge. The once-flat plateau becomes shorter and steeper. The battery loses capacity and cannot hold as much energy. Scientists use special tools like incremental capacity curves and temperature profiles to measure these changes. Degraded batteries show smoother peaks in these curves and different temperature patterns. These signs help people spot aging and predict when a battery needs replacement.
Consejo: Healthy batteries have gradual voltage changes. Degraded batteries show rapid drops and less energy output.
A table can help compare the two:
| Característica | Healthy Battery | Degraded Battery |
|---|---|---|
| Voltage Plateau | Long and flat | Short and sloped |
| Voltage Drop Near End | Gradual | Rapid |
| Internal Resistance | Bajo | Alta |
| Discharge Capacity | Alta | Reduced |
| Temperature Profile | Stable | More variable |
Monitoring these curve features gives a clear view of battery health and helps users make smart choices about battery use.
Effects of Temperature and Discharge Rate
Temperature and discharge rate have a big impact on how a lithium-ion battery performs. High discharge rates make the battery work harder. This stress causes the voltage to drop faster and reduces the amount of usable energy. Low temperatures slow down the chemical reactions inside the battery. When it gets cold, the battery cannot deliver as much power, and the voltage drops more quickly.
Experimental data shows that at room temperature (27°C), a battery can deliver 100% of its rated capacity. At freezing temperatures (0°C or below), the capacity drops sharply. For example, at –18°C (0°F), the battery may only provide about half its normal capacity. The effect of discharge rate is also clear. At higher rates, the battery loses more capacity, especially in the cold.
| Condición | Capacity Impact on Li-ion Battery |
|---|---|
| At 27°C (room temperature) | 100% capacity (baseline) |
| At –18°C (0°F) | ~50% capacity (50% reduction) |
| 1C discharge at 0°C | 6.43% capacity reduction |
| 2C discharge at 0°C | 7.72% capacity reduction |
| 3C discharge at 0°C | 8.42% capacity reduction |
When the battery warms up again, some lost capacity returns. However, repeated exposure to cold or high discharge rates can cause lasting damage. Experimental results confirm that at low temperatures, the battery’s voltage drops more, and the battery heats up faster. These changes make the discharge curve steeper and shorten the battery’s useful life.
Nota: Avoid using devices in extreme cold or drawing too much power at once. These habits protect battery health and extend battery life.
Diagnostic Techniques
OCV Analysis
Open Circuit Voltage (OCV) analysis measures a battery’s voltage when it is at rest. This voltage shows the true state of the battery’s chemistry. To get an accurate OCV reading, the battery must rest for a long time after charging or discharging. This rest period lets the voltage settle and removes effects from recent use. People use a high-resolution voltmeter and keep the battery at a steady temperature for best results. They also use temperature compensation to correct any changes caused by heat or cold.
Steps for OCV Analysis:
- Discharge the battery fully, then charge it back at a very low current.
- Let the battery rest after each step to allow the voltage to relax.
- Record the voltage and state of charge (SOC) at each point.
- Repeat at different temperatures for more accurate results.
- Use the data to create an OCV curve that matches the battery’s SOC.
OCV analysis helps estimate State of Health (SOH) by showing how the OCV curve changes as the battery ages. A compressed OCV curve means the battery has lost capacity. This method works well for many battery types and gives accurate SOH results.
| Aspecto | Descripción |
|---|---|
| Model Development | OCV curve models battery aging and capacity loss. |
| Validation | SOH estimates match real values within about 2%. |
| Applicability | Works for different chemistries and cell designs. |
| Conclusión | OCV analysis reliably tracks battery health over time. |
Incremental Capacity (ICA)
Incremental Capacity Analysis (ICA) uses voltage and capacity data from charge or discharge cycles. It calculates how much capacity changes for each small change in voltage. This method highlights small changes inside the battery that show aging.
How to Perform ICA:
- Collect voltage and capacity data during charging or discharging.
- Calculate the change in capacity for each change in voltage (dQ/dV).
- Smooth the curve to remove noise.
- Look for peaks and valleys, which show important battery reactions.
- Track these features over time to see how the battery ages.
ICA does not need extra sensors. It works with data from most battery management systems. ICA can spot problems like loss of active material or lithium. It helps estimate SOH by linking changes in the curve to battery health. ICA works well for electric vehicles and second-life batteries.
Differential Voltage (DVA)
Differential Voltage Analysis (DVA) examines how voltage changes with capacity (dV/dQ). DVA reveals chemical changes inside the battery, such as lithium movement and material loss.
Practical Uses of DVA:
- DVA can quickly diagnose battery health using only a short discharge cycle.
- It finds peaks that match reactions in the battery’s electrodes.
- DVA can detect loss of active material and lithium inventory.
- It works with machine learning to estimate SOH with high accuracy.
DVA is sensitive to small voltage changes, making it useful for real-time battery monitoring. It helps battery management systems track aging and safety without damaging the battery.
Battery Types and Discharge Behavior

Common Li-ion Chemistries
Many devices use lithium-ion batteries, but not all batteries are the same. Different chemistries give each battery unique strengths and weaknesses. The most common types include Lithium Cobalt Oxide (LCO), Lithium Manganese Oxide (LMO), Lithium Iron Phosphate (LFP), Lithium Nickel Manganese Cobalt Oxide (NMC), Lithium Nickel Cobalt Aluminum Oxide (NCA), and Lithium Titanate (LTO). Each chemistry fits certain needs, from powering smartphones to running electric cars.
| Li-ion Chemistry | Aplicaciones comunes | Características principales |
|---|---|---|
| Óxido de litio y cobalto (LCO) | Phones, cameras, laptops | High energy density, lower thermal stability |
| Óxido de litio y manganeso (LMO) | Power tools, some EVs, medical devices | High current delivery, good safety, shorter cycle life |
| Fosfato de litio y hierro (LFP) | E-bikes, e-rickshaws, cars, industrial equipment | Long cycle life, high thermal stability, cost-effective |
| Óxido de litio, níquel, manganeso y cobalto (NMC) | Electric vehicles, UPS systems | Balanced cost and performance, good thermal stability |
| Óxido de litio, níquel, cobalto y aluminio (NCA) | Some EVs, industrial equipment | High energy density, needs extra safety measures |
| Lithium Titanate (LTO) | Aerospace, military, grid storage, some EVs | Excellent cycle life, high stability, costly |
LCO batteries power most consumer electronics because they store a lot of energy in a small space. LFP and NMC batteries appear often in electric vehicles. LFP batteries last longer and stay safer, while NMC batteries balance cost and performance. LTO batteries work well in special cases where long life and safety matter most.
Discharge Characteristics Compared
Each battery chemistry behaves differently during discharge. NMC batteries offer a good mix of energy and power. They work well at moderate discharge rates and keep a steady voltage. NCA batteries store more energy and can deliver higher power, but they do not last as long and need extra safety steps. LFP batteries stand out for safety and long life, but they have lower voltage and energy density.
| Química | Tensión nominal | Discharge C-rate | Cut-off Voltage | Cycle Life (cycles) | Densidad energética (Wh/kg) | Key Discharge Characteristics |
|---|---|---|---|---|---|---|
| NMC | 3.6-3.7 V | ~1C (up to 2C) | ~2.5 V | 1000-2000 | 150-220 | Balanced energy and power, good stability |
| NCA | 3.6 V | ~1C (up to 3C) | ~3.0 V | ~500 | 200-260 | High energy, fast discharge, shorter life |
| LFP (LTO) | 2.4 V (LTO) | Up to 10C+ | N/A | 15,000-20,000 (LTO) | Lower than NMC/NCA | Very safe, long life, lower energy |
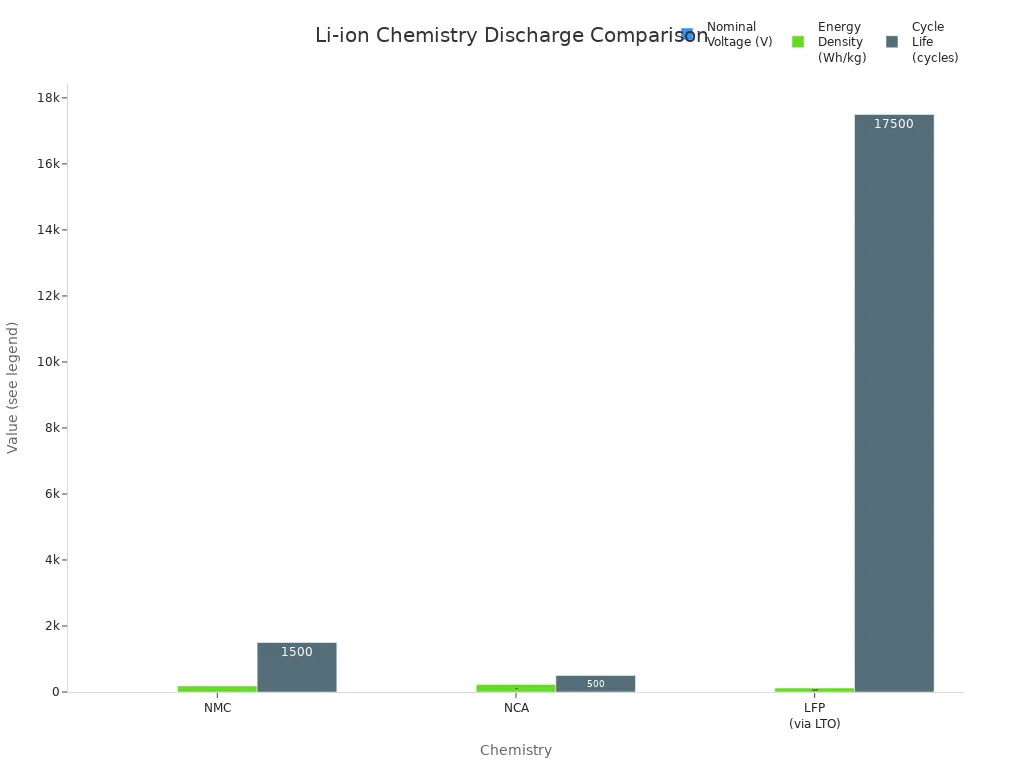
- NCA batteries deliver high energy and fast power but wear out faster.
- LFP and LTO batteries last much longer and stay safer, but store less energy.
- NMC batteries balance energy, power, and safety, making them popular in electric vehicles.
Choosing the right battery chemistry depends on the device’s needs. Some devices need more energy, while others need longer life or better safety.
Monitoring and Improving Battery Health
Collecting Discharge Data
Collecting discharge data starts with the right tools and careful observation. Many users begin by using a simple multimeter to check battery voltage. This method helps spot early signs of battery wear, such as a sudden drop in voltage. Visual inspection also plays a key role. Swelling, leaks, or changes in color can signal problems inside the battery.
For more advanced monitoring, battery health apps like AccuBattery for Android or Battery Life for iOS track charge cycles, overheating, and unexpected shutdowns. These apps give users easy access to performance data and alert them to early warning signs.
Professional labs and manufacturers use high-precision instruments. Devices like the Keysight BT2152B Self-Discharge Analyzer measure self-discharge current quickly and accurately. These analyzers use denoising algorithms, such as median subtraction and principal component analysis (PCA), to remove noise from the data. This makes the results clearer and more reliable. Real-time denoising helps users see accurate trends as they happen.
Consejo: Always collect data in a stable environment. Keep the battery at a steady temperature and avoid moving it during tests.
High-quality data acquisition software supports real-time monitoring, customizable test protocols, and easy data export. Automation features reduce human error and allow for long-term testing. Integrated temperature control is important because lithium-ion batteries react strongly to temperature changes. Scalable equipment lets users test different battery sizes and adapt to new needs.
Interpreting Results
Interpreting discharge data helps users understand how well a battery works. Simple steps, like checking voltage with a multimeter or using a battery health app, can reveal early signs of trouble. Users should look for patterns such as faster voltage drops, longer charging times, or unexpected shutdowns. These signs often mean the battery is aging or damaged.
Advanced diagnostic tools provide deeper insights. Electrochemical Impedance Spectroscopy (EIS) analyzes internal cell processes and helps create models of battery behavior. Software like RelaxIS supports this analysis, making it easier to spot changes in cell impedance and quality. Self-Discharge Analyzers, such as the BT2152B, measure how much current a battery loses when not in use. This helps identify batteries that may fail soon.
High-precision instruments control voltage, current, temperature, and pressure during tests. Comprehensive software collects and analyzes data in real time. Automation reduces mistakes and supports long tests. Temperature control ensures accurate results because batteries perform differently in hot or cold conditions.
Simple monitoring steps work well for routine checks and early detection. Advanced diagnostics, like machine learning models, predict battery health with high accuracy and help extend battery life.
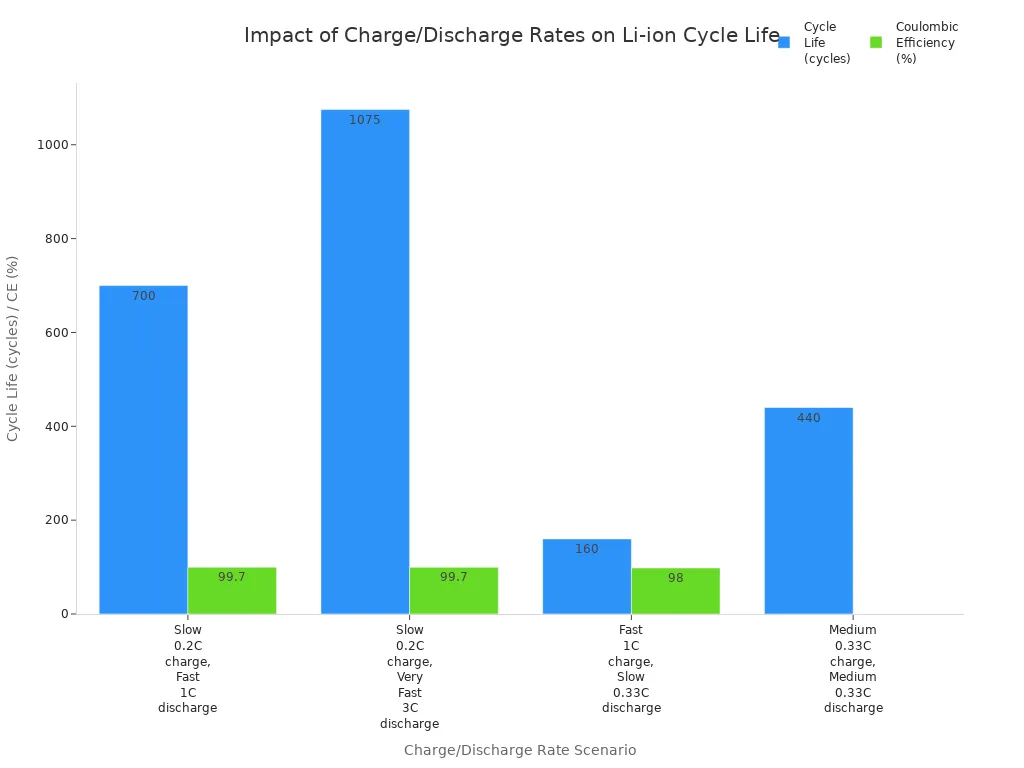
Best Practices for Longevity
Users can follow several best practices to keep lithium-ion batteries healthy and extend their lifespan. Research shows that avoiding full discharges and high discharge rates is key. Batteries last longer when users keep them within an optimal charge range and avoid letting them drop to 0% or charge to 100% too often.
| Tarifa | Discharge Rate | Cycle Life (cycles) | Coulombic Efficiency (CE) | Key Findings |
|---|---|---|---|---|
| Slow (0.2C) | Fast (1C) | ~700 | Up to 99.7% | Slow charge and fast discharge improve cycle life and efficiency. |
| Slow (0.2C) | Very Fast (3C) | ~1075 | Up to 99.7% | Even faster discharge with slow charging further increases cycle life. |
| Fast (1C) | Slow (0.33C) | ~160 | ~98% | Fast charging and slow discharge reduce cycle life. |
| Medium (0.33C) | Medium (0.33C) | ~440 | N/A | Balanced rates offer moderate cycle life. |
A few simple steps help users get the most from their batteries:
- Charge new batteries as soon as possible after receiving them. This prevents voltage from dropping too low.
- Avoid exposing batteries to extreme heat or cold.
- Keep the battery charge between 20% and 80% for daily use.
- Limit high current loads, such as running many apps or using power-hungry features at once.
- Use a battery management system (BMS) when possible to monitor and control charging and discharging.
- Store batteries in a cool, dry place if not used for a long time.
- Educate all users about proper battery care to prevent early replacement.
Charging and discharging batteries in a controlled way, while avoiding full discharges, helps reduce wear and keeps battery health strong.
Simple monitoring steps, such as checking for swelling or using a battery health app, work well for most users. Advanced diagnostics, like EIS or machine learning models, offer even more accurate predictions for those who need them. Both approaches help users spot problems early and take action to extend battery life.
Quick Battery Health Checklist
Key Steps for Monitoring
Industry experts recommend a clear set of steps for anyone who wants to keep lithium-ion batteries healthy. The following table shows the most important actions and tools for regular battery monitoring:
| Paso Categoría | Essential Steps and Recommendations |
|---|---|
| Early Warning Signs | – Watch for long charging times – Notice device overheating – Check for unexpected shutdowns – Look for swollen batteries – Track reduced runtime |
| Diagnostic Apps | – Use Battery Life (iOS) and AccuBattery (Android) for detailed battery health diagnostics |
| Voltage and Performance Test | – Measure battery voltage with a multimeter – Compare readings to manufacturer specifications – Repeat tests regularly to track changes |
| Battery Cycle Count | – Check cycle count in device settings – Typical lifespan: 300-500 full charge cycles |
| Specialized Tools | – Use battery testers for charge/discharge rates – Try analyzers for internal resistance – Use thermal cameras for heat detection – Rely on Battery Management Systems (BMS) for monitoring and protection |
| Professional Services | – Seek professional testing for thorough evaluation and safety – Experts can identify hazards and device vs battery issues |
| Practical Maintenance Tips | – Monitor batteries regularly – Avoid overcharging (keep charge between 20%-80%) – Clean battery terminals – Store in cool places |
Regular checks and simple tools help users spot problems early and keep batteries working longer.
Warning Signs
Certain warning signs show when a lithium-ion battery may fail soon. Users should pay attention to these symptoms during daily use or while checking discharge data. Abnormal temperature rises, changes in charging voltage or current, and physical changes often signal trouble. Advanced monitoring systems can even predict dangerous events before they happen by tracking these patterns.
- Swelling of the cell or battery, which shows internal damage
- Unusual or excessive heating, especially above 45°C during use or when the battery feels hot at rest
- Discoloration or melting of the battery casing
- Audible noises such as hissing or cracking
- Odor or smoke, which may mean a fire has started
If any of these signs appear, users should stop using the device and seek help from a professional. Early action prevents accidents and protects both devices and users.
Recent research highlights several key takeaways for managing lithium-ion batteries:
- Discharge capacity serves as a primary indicator of battery condition, with capacity fade signaling when replacement is needed.
- Factors such as aging, temperature, and load influence battery degradation.
- Data-driven models using discharge data improve predictions of battery lifespan and support timely maintenance.
Readers can benefit right away by following these tips:
- Keep carga entre 20% y 80% to reduce wear.
- Avoid overheating and deep discharges.
- Use monitoring apps for real-time alerts and diagnostics.
- Check battery indicators regularly and update software for efficiency.
Applying these steps helps users extend device life and avoid common mistakes.
PREGUNTAS FRECUENTES
How often should someone check their battery’s discharge data?
Experts recommend checking discharge data once a month. Regular checks help users spot early signs of battery aging. This habit can prevent sudden failures and extend battery life.
Can a phone app really help monitor battery health?
Yes. Many apps track charge cycles, voltage, and temperature. These apps give users easy-to-read reports. They also send alerts if the battery shows warning signs.
What is the safest way to store a lithium-ion battery?
Store batteries at room temperature. Keep the charge between 40% and 60%. Avoid direct sunlight and moisture. This method helps prevent damage and keeps the battery healthy.
Why does my battery lose capacity in cold weather?
Cold temperatures slow chemical reactions inside the battery. The battery cannot deliver as much energy. Users may notice shorter run times and faster voltage drops.
Is it bad to let a battery fully discharge before charging?
Yes. Full discharges stress the battery and shorten its lifespan. Charging before the battery drops below 20% helps maintain health and performance.