

Li-ion battery discharge curve analysis gives you a reliable path to boost device performance. When you track and interpret discharge patterns, you can prevent deep discharges, reduce risks of system shutdowns, and extend battery lifespan. Data-driven models using voltage and current curves reach over 95% accuracy in battery health predictions, helping you manage batteries better. Modern tools like battery testers y machine learning let you optimize usage in real time. These insights turn into practical gains—longer battery life, fewer failures, and more reliable devices.
Discharge Curve Basics

What Is a Discharge Curve
A Li-ion battery discharge curve shows you how the voltage of a battery changes as it releases energy. You see this curve when you measure the voltage from a fully charged state down to a cutoff point, usually around 3,0 V por célula. You create the curve by discharging the battery at a constant current, known as a C-rate, and recording the voltage at each step. This process helps you understand how the battery behaves under different loads and temperatures.
You will notice that the curve looks different for various battery types. Energy Cells focus on storing more energy, so their curves stretch longer. Power Cells deliver high current, so their curves drop faster. The flat part of the curve in Li-ion batteries makes it easier for you to estimate how much charge remains. By studying these curves, you can compare battery performance in devices like smartphones, power tools, or even electric vehicles.
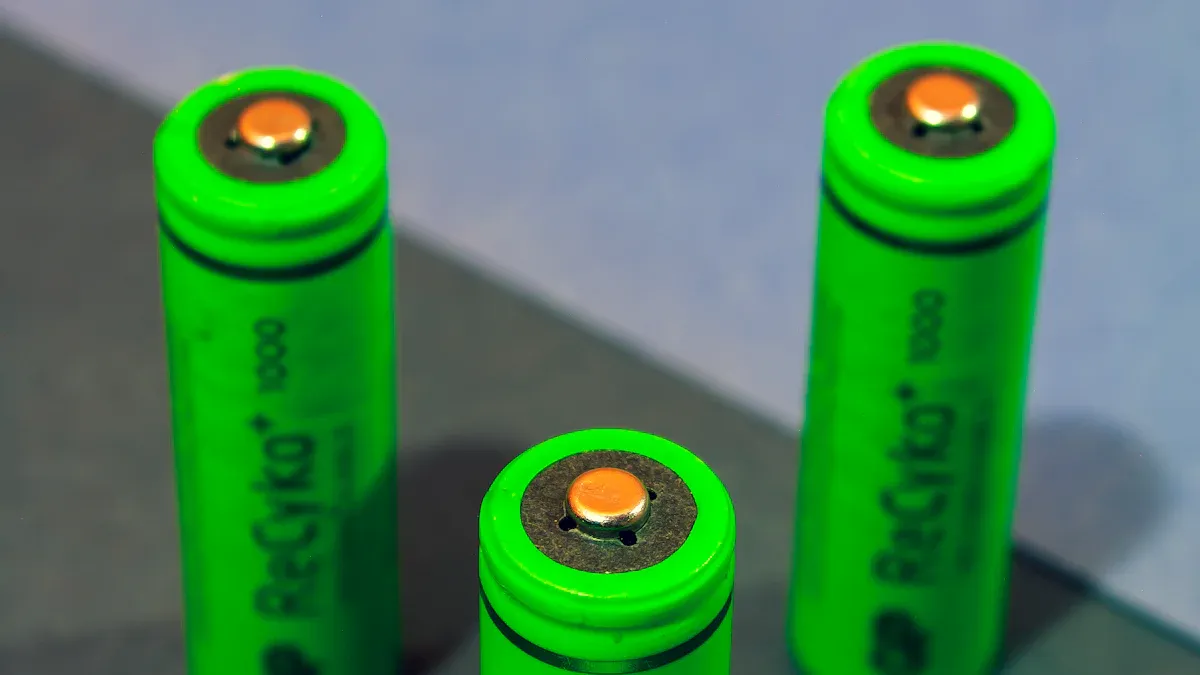
Consejo: Always use a reliable battery tester to record accurate discharge curves. This ensures you get consistent results for analysis.
Por qué es importante
Understanding the discharge curve gives you a clear picture of your battery’s health and efficiency. The curve shows how voltage drops during use, which helps you spot problems early. You can avoid deep discharges that damage the battery and shorten its life. By monitoring the curve, you can adjust how you charge and use the battery to fit your device’s needs.
Manufacturers and users rely on discharge curves to design better products and manage batteries more effectively. Factors like temperature, discharge rate, and battery age all shape the curve. When you track these changes, you improve energy management and extend battery life. This approach works for everything from consumer electronics to large-scale energy storage.
- Key Benefits of Discharge Curve Analysis:
- Detect battery aging early
- Optimize charging and discharging routines
- Improve device reliability and lifespan
Analysis Methods
Machine Learning Models
You can use machine learning models to predict how your Li-ion battery will perform during discharge. These models help you find patterns in large sets of voltage, current, and temperature data. By using these patterns, you can forecast battery health, remaining capacity, and even spot early signs of failure.
Survival analysis models, such as CoxTime and MTLR, stand out for their high prediction accuracy. CoxTime works best with discharge data, while MTLR excels with charging data. Traditional regression models like SVR, RVM, and GPR also play a role. They capture nonlinear battery degradation but may need careful tuning and more computing power.
Here is a comparison of common machine learning models for analyzing Li-ion battery discharge curves:
| Model | Best Performance Context | Prediction Accuracy (C-Index) | Notes on Performance and Characteristics |
|---|---|---|---|
| CoxTime | Discharging Data | Highest C-Index ~0.862 | Top performer for discharge curves; benefits significantly from larger datasets; sensitive to feature complexity |
| MTLR | Charging Data | Highest C-Index ~0.851 | Best for charging data; stable and high-performing; improves steadily with more data |
| Cox | Discharging Data | Competitive (~0.859) | Reliable with steady improvement; slightly lower than CoxTime; robust across depths |
| CoxPH | Both | Lower accuracy | Weaker performer; less adaptable to nonlinear dependencies |
| DeepHit | Both | Moderate and variable | Shows fluctuations; less stable with data size changes |
| SVR | Data-driven regression | High accuracy but parameter sensitive | Models nonlinear degradation well; sensitive to parameter tuning |
| RVM | Data-driven regression | Provides probabilistic outputs | Useful for reliability-critical applications; higher computational cost |
| GPR | Data-driven regression | Provides confidence intervals | Models nonlinear relationships; scalability issues |

Ensemble learning methods, such as AdaBoost, XGBoost, and LightGBM, combine the strengths of multiple models. These methods reduce errors and improve prediction accuracy. For example, LightGBM achieves a high R-squared value of 0.887, showing strong correlation between predicted and actual battery capacity. SHAP analysis reveals that temperature, cycle index, voltage, and current have the most influence on predictions. By using ensemble models, you can capture complex battery behaviors and make better decisions for battery management.
Consejo: Use ensemble models when you want to improve prediction accuracy and handle complex battery data.
RC Equivalent Circuit
You can use the RC equivalent circuit model to simulate how a Li-ion battery behaves during charge and discharge. This model represents the battery as a network of resistors and capacitors. It helps you understand voltage drops and dynamic responses during operation.
| Aspecto | Descripción |
|---|---|
| Model Components | Variable voltage source (OCV), internal resistance (R0), one or more RC parallel networks (Ri, Ci) |
| Purpose of RC Networks | Simulate dynamic voltage drops during discharge/charge transients |
| Number of RC Parallels | Typically 1 or 2 for balance between accuracy and complexity |
| State Variables | State of charge (SoC) via Coulomb counting; voltage across each RC parallel via differential equations |
| Voltage Calculation | Terminal voltage computed from OCV-SoC relationship, internal resistance, and RC voltages |
| Parameter Identification Methods | Time domain (pulse tests), Frequency domain (Electrochemical Impedance Spectroscopy – EIS) |
| Accuracy | Good within calibration range and moderate current profiles; accuracy decreases at high currents and long pulses |
| Limitations | Less accurate than physics-based models (PBM) at high rates and outside calibration range |
- The RC equivalent circuit model captures essential battery behavior using resistors, capacitors, and voltage sources.
- Adding more RC networks increases accuracy but also makes the model more complex.
- You identify model parameters by studying the relationship between state of charge (SOC) and open-circuit voltage (OCV).
- The model works well for typical operating conditions but loses accuracy at high current rates or during long discharges.
The RC model offers a good balance between accuracy and simplicity. You can use it for real-time battery management and quick simulations. However, for extreme conditions or detailed analysis, you may need a more advanced model.
Electrochemical Modeling
Electrochemical modeling gives you a deep look into the internal processes of a Li-ion battery. This method simulates chemical reactions, lithium-ion movement, and changes inside the electrodes. You can use it to predict battery behavior, health, and degradation with high accuracy.
| Aspecto | Advantages of Electrochemical Modeling (Physics-based) | Limitations of Electrochemical Modeling (Physics-based) |
|---|---|---|
| Accuracy | High accuracy in predicting battery behavior and health | High computational complexity |
| Interpretability | Strong interpretability providing deep physical insights | Parameter sensitivity and challenges in parameterization |
| Extensibility | Extensible to include various degradation mechanisms | Difficulty in simulating complex degradation processes (e.g., SEI growth, lithium dendrites, active material loss) |
| Practical Application | Provides theoretical guidance and detailed understanding of battery internal processes | Requires stable operating conditions and high-precision data acquisition; complex to apply in engineering contexts |
| Model Specificity | Can be tailored to specific battery chemistries and conditions | Needs further validation across diverse batteries and environments |
- Ventajas:
- You get high accuracy and strong physical insights.
- You can extend the model to include different types of battery aging and failure.
- Limitations:
- The model requires a lot of computing power and precise data.
- It can be hard to estimate all the needed parameters.
- You may find it challenging to use for real-time or large-scale applications.
Electrochemical modeling helps you understand the root causes of battery degradation. You can use it to design better batteries and predict long-term performance. Recent advances combine these models with machine learning to improve both accuracy and speed.
Nota: Choose electrochemical modeling when you need detailed insights and can handle higher computational demands.
Key Parameters
Capacity and Efficiency
You rely on battery capacity to know how much energy your device can use before it needs a recharge. Capacity tells you the total charge a battery can deliver, usually measured in ampere-hours (Ah) or milliampere-hours (mAh). Efficiency shows how well the battery converts stored energy into usable power for your device. High efficiency means less energy wasted as heat.
Several factors shape capacity and efficiency:
- C-rate (discharge current rate): Higher C-rates make the battery deliver energy faster, but this reduces effective capacity and causes a bigger voltage drop.
- Temperatura: Cold temperatures can cause lithium plating and lower capacity. Hot temperatures speed up chemical breakdown.
- Battery chemistry: Different chemistries create different discharge curve shapes and affect how much energy you can use.
- Polarization effects: These include IR drop and other voltage losses during discharge.
Consejo: Always consider operating conditions like temperature and discharge rate when you analyze battery performance. These factors can change the shape of the discharge curve and the usable capacity.
Internal Resistance
Internal resistance plays a big role in how well your battery performs during discharge. Lower internal resistance lets your battery deliver higher currents without large voltage drops. This means your device can run longer and handle heavy loads better.
When la resistencia interna aumenta, you see more voltage drop during use. This can cause your device to shut down early, even if the battery still holds charge. Internal resistance stays steady for most of the battery’s life but increases at very low or high states of charge and as the battery ages. For example, a Li-ion battery with 320 milliohms of internal resistance can handle high current pulses, like those in mobile phones. If resistance climbs higher, performance drops and usable capacity shrinks.
| Parámetro | Effect on Performance |
|---|---|
| Baja resistencia interna | Longer runtime, better high-current support |
| High Internal Resistance | Shorter runtime, early voltage cutoff |
Ciclo de vida
Cycle life measures how many times you can charge and discharge your battery before it loses significant capacity. This parameter directly affects how long your device will last and how reliable it remains over time.
Battery chemistry makes a big difference. Lithium iron phosphate batteries last much longer than lithium cobalt oxide types. The way you use your battery also matters. If you use micro-cycles—charging and discharging only a small part of the battery’s capacity—your battery can last up to 50% longer compared to deep cycles. Micro-cycled batteries can reach nearly 3,000 full cycle equivalents, while those exposed only to deep cycles may last about 1,500 cycles.
Nota: Fewer deep cycles and more partial cycles help extend your battery’s lifespan and keep your device reliable for longer.
Device Performance Impact

Sistemas de gestión de baterías
A Battery Management System (BMS) acts as the brain of your battery-powered device. You rely on the BMS to monitor voltage, current, and temperature with high accuracy. This system collects time-synchronized data, which helps you track the discharge curve and understand how your battery performs in real time. When you use a BMS, you gain several advantages:
- You get continuous health assessments based on precise discharge data.
- The BMS can spot errors in readings, which protects your device from unexpected failures.
- It balances cells by using discharge data, making sure each cell works at its best.
- The system prevents over-discharge and hazardous conditions, keeping your device safe.
A BMS uses advanced analytics, including machine learning, to predict how long your battery will last. By analyzing discharge patterns, the BMS can estimate the state of health and remaining useful life. This proactive approach lets you optimize battery usage, extend lifespan, and improve device performance. Real-time data from sensors and IoT devices gives you a clear view of battery behavior, even as conditions change. When you manage your battery within safe limits, you boost reliability and get the most out of your device.
Consejo: Always keep your BMS firmware updated to take advantage of the latest features for battery safety and device performance.
Discharge Rate Optimization
You can make your battery last longer and your device work better by optimizing the discharge rate. The BMS plays a key role here. It regulates how fast your battery charges and discharges, manages cell balancing, and keeps the state of charge within safe limits. When you use active balancing, the system moves charge between cells to reduce differences in state of charge and health. This process slows down aging and keeps your battery working well.
Machine learning models inside the BMS analyze how you use your device. These models predict when your battery might wear out and help you adjust charging and discharging strategies. By doing this, you can avoid deep discharges that shorten battery life. For example, raising the lower cutoff voltage during discharge cycles can extend the cycle life of your battery by over 30%. This means your device will run longer before you need a replacement.
Different balancing methods, like capacitor- or inductor-based designs, make the process faster and more efficient. When you control the discharge rate and depth, you protect your battery from stress and improve device performance. Accurate state of health models also help you plan maintenance and avoid unexpected shutdowns.
- Benefits of Discharge Rate Optimization:
- Longer battery lifespan
- More reliable device performance
- Fewer unexpected failures
PID Controllers
PID controllers help you keep your battery and device running smoothly. You find these controllers in advanced battery management systems, especially in setups that use renewable energy. A PID controller adjusts charging and discharging by watching the output current and keeping the state of charge within safe limits. This control prevents your battery from overcharging or running too low.
Fuzzy PID controllers take this a step further. They adapt to changing conditions, like when solar or wind power changes quickly. These controllers do not need complex math models, so they work well in real time. Optimization algorithms, such as Particle Swarm Optimization, fine-tune the PID settings. This process improves battery life, increases charging efficiency, and keeps temperatures lower during use.
The battery management system uses fuzzy logic to decide when to charge or discharge. It responds to changes in load and power generation, making sure your battery stays healthy. By keeping the state of charge in a safe range, PID controllers help you maintain optimal device performance. You get stable operation, longer battery life, and better results from your device.
Nota: Using PID controllers in your battery system gives you more control and helps you respond quickly to changes, which is key for top device performance.
Practical Optimization
Measurement Tools
You need precise tools to capture accurate Li-ion battery discharge curves. High-precision measurement and calibration platforms work best for this task. These platforms combine a bidirectional power module, which handles both charging and discharging, with a wide voltage range from 50 V to 950 V and a rated power of 6 KW. They include energy measurement modules that achieve DC voltage and current accuracy within ±0.012%RD + 0.008%RG. Real-time communication happens through CAN protocol, making it easy to monitor and control the process. The system uses constant current–constant voltage (CCCV) charging and standard current discharging to measure capacity and voltage curves precisely. Advanced features, such as aging trajectory prediction and Power Hardware-in-the-Loop (PHIL) simulation, help you update battery models as the battery ages. These platforms also automate battery connection, cycle testing, data display, and storage, so you can refine your battery models with every test.
Data Interpretation
When you analyze discharge data, you gain insights into battery health and performance. Look for patterns in voltage drops, capacity loss, and temperature changes. Use historical discharge data to predict aging trends and schedule battery replacements before failures occur. Sistemas de gestión de baterías (BMS) help you monitor discharge current, voltage, and temperature in real time. By leveraging this data, you can detect cell imbalances or abnormal discharge patterns early. Data-driven predictive maintenance lets you address issues before they impact device performance. Remote monitoring features in advanced BMS allow you to manage battery health across multiple devices or locations.
Actionable Tips
- Use the Constant Current–Constant Voltage (CC-CV) charging method to prevent overcharging and overheating.
- Keep charging and operating temperatures between 15°C and 35°C for optimal battery life.
- Avoid full discharges and frequent full charges; maintain charge levels between 20% and 80%.
- Store batteries at about 50% charge when not in use to slow degradation.
- Always use chargers designed for your battery’s chemistry and follow manufacturer guidelines.
- Monitor charging current and voltage to catch abnormalities early.
- Implement adaptive charging algorithms that adjust to real-time battery conditions.
- Use pulse charging to reduce internal stress and heat buildup.
- Avoid continuous trickle charging, which can shorten battery life.
- Apply discharge data insights to optimize device settings and improve system efficiency.
By following these tips and using advanced tools, you can extend battery life and boost device performance.
Factores que influyen
Temperatura
Temperature plays a major role in how your Li-ion battery performs. When you use your device in high temperatures, the battery’s internal reactions speed up. This can lower internal resistance and improve short-term performance. However, high heat also causes the battery to age much faster—sometimes up to 14 times faster. You may notice your battery losing capacity or swelling if it gets too hot. On the other hand, cold temperatures slow down the movement of lithium ions. This makes the battery less efficient and can cause it to lose capacity during use. At very low temperatures, you risk lithium plating, which can lead to permanent damage and even safety hazards.
- High temperatures boost reaction rates but speed up aging and side reactions.
- Low temperatures increase resistance and can cause lithium plating.
- Both extremes reduce the battery’s effective capacity and lifespan.
Consejo: Keep your device within the recommended temperature range to protect battery health and ensure reliable performance.
Current Density
Current density, or how much current flows through the battery per unit area, affects both efficiency and the shape of the discharge curve. When you draw high current from your battery, you see a bigger voltage drop and lower energy efficiency. Over time, high discharge currents can speed up battery wear and reduce how much energy you get from each charge. Lower current densities help your battery last longer and deliver more consistent power.
- High discharge currents lower energy efficiency and cause faster degradation.
- The discharge curve drops more sharply at higher current densities.
- Battery Management Systems use this information to adjust discharge rates and extend battery life.
Battery Age
As your battery ages, you will notice changes in how it performs. The battery’s capacity drops because the active materials inside break down over time. Internal resistance rises, which means your device may shut down sooner or struggle to meet power demands. For example, a battery that once held 2.8 Ah might only hold 1.7 Ah after many cycles. The discharge curve becomes steeper, and the battery heats up more during use. Most batteries reach end-of-life when their capacity falls below 80% or their resistance doubles.
| Aging Effect | Impact on Battery Performance |
|---|---|
| Pérdida de capacidad | Shorter run time, less energy stored |
| Increased resistance | Higher voltage drop, more heat |
| Steeper discharge curve | Reduced power output, early shutdown |
Regularly monitor your battery’s health to catch signs of aging early and maintain top device performance.
Aplicaciones
Dispositivos de consumo
You use Li-ion batteries every day in smartphones, tablets, and wearables. Discharge curve analysis helps you get the most out of these devices. By studying how voltage drops during use, you can spot when a battery starts to age or lose capacity. This lets you plan for replacements before your device fails. Manufacturers use this data to design smarter battery management systems. These systems adjust charging and discharging to match your usage patterns. As a result, your devices last longer, charge faster, and stay safe. You benefit from fewer unexpected shutdowns and more reliable performance.
Consejo: Keep your device’s software updated. Many updates include improvements to battery management based on new discharge curve data.
Vehículos eléctricos
You rely on Li-ion batteries to power electric vehicles (EVs) for daily commutes and long trips. Discharge curve analysis plays a key role in optimizing battery performance in EVs. By controlling the Depth of Discharge (DOD) according to the battery’s State of Health (SOH), you can extend battery life and improve safety. For example, studies on 18,650 cylindrical batteries show that adjusting DOD settings—using DOD70 at 100–90% SOH and DOD60 at 90–80% SOH—boosts total discharge energy by about 45% compared to using DOD60 alone. This approach helps you balance driving range with long-term battery health. It also reduces risks from structural instability and impurities in high-nickel cathode materials. Discharge curve analysis lets you manage charge cycles and thermal conditions, so your EV runs longer and stays safer.
Uso industrial
You see Li-ion batteries in factories, robotics, and backup power systems. Discharge curve analysis helps you select the right battery for each job and design systems that last. The table below shows how different discharge rates affect voltage, temperature, and reliability:
| Discharge Rate (C Rate) | Voltage Behavior | Temperature Behavior | Role in Reliability and Efficiency |
|---|---|---|---|
| 0.2C (Low) | Slow voltage drop, steady energy | Minimal temperature rise | Stable, long-duration performance; prevents overheating and capacity loss |
| 0.5C (Moderate) | Moderate voltage drop | Moderate temperature rise | Balances endurance and performance; optimizes efficiency and thermal safety |
| 1C (High) | Noticeable voltage drop | Higher temperature rise | Supports balanced power and runtime; needs thermal management for reliability |
| 2C (Very High) | Rapid voltage drop | Significant temperature rise | Enables high power bursts; demands advanced cooling for safety and efficiency |
- Discharge curve analysis shows you how voltage and capacity change at different rates, so you can match batteries to your power needs.
- Temperature rise curves act as a warning, helping you prevent overheating and failures.
- You can use this data to design better batteries, choose safer materials, and build smarter cooling systems.
- This analysis helps you keep your equipment running smoothly, even in tough environments or with high power demands.
Regular discharge curve monitoring keeps your industrial systems efficient, reliable, and safe.
You gain real advantages when you analyze Li-ion battery discharge curves. This approach helps you boost device performance, extend battery life, and prevent failures. By applying both simple and advanced analysis methods, you can make real improvements in your devices. Ongoing monitoring with tools like unified iontronic sensing lets you:
- Detect early signs of battery aging and safety risks
- Track pressure changes that reveal capacity loss
- Adjust discharge protocols to slow down degradation
Continuous optimization ensures your devices stay reliable and efficient for years.
PREGUNTAS FRECUENTES
How often should you analyze your Li-ion battery’s discharge curve?
You should check your battery’s discharge curve every few months. Frequent analysis helps you spot early signs of aging or performance drops. This routine keeps your device reliable and extends battery life.
What tools do you need for accurate discharge curve measurement?
You need a high-precision battery tester and a data logger. These tools record voltage, current, and temperature during discharge. Reliable equipment ensures you get consistent and accurate results.
Can you use discharge curve analysis for all Li-ion battery types?
Yes, you can apply discharge curve analysis to all Li-ion batteries. Each chemistry shows unique curve patterns. You should adjust your analysis method to match the specific battery type for best results.
What is the main benefit of using machine learning in battery analysis?
Machine learning helps you predict battery health and lifespan with high accuracy. It finds hidden patterns in your data. This approach lets you make smarter decisions about battery use and replacement.
How does temperature affect your battery’s discharge curve?
High temperatures speed up chemical reactions and aging. Low temperatures slow down ion movement and reduce capacity. You should keep your battery within the recommended temperature range for stable performance.