

What Is a LiPo Voltage Chart—and Why Does It Matter?
You might wonder: If your LiPo battery shows 3.7V per cell, is it still nearly full—or nearly empty? Many users treat voltage as a direct “fuel gauge,” but the truth is trickier. The LiPo voltage chart is a table or curve that maps out how cell voltage correlates (often non-linearly) to remaining capacity. Understanding this is crucial to get reliable runtime estimates, avoid deep discharge, and extend battery life—whether in drones, robotics, or medical devices.
Analogie: Think of a water tank with a stretchy rubber membrane. Early on, water pressure (voltage) stays level even as you use up most of the supply. Only near the bottom does it plunge rapidly. That’s how LiPo voltage behaves!
The Voltage/Capacity Chart—Your Battery’s Real Map
A typical LiPo battery cell has several voltage states that correspond to a percentage of remaining capacity (% State of Charge, or SOC). But real capacity drops off sharply once you reach low voltages.
Core Chart (Resting and Loaded States)
| SOC (%) | Resting V/cell | Under Load V/cell | Key Points |
|---|---|---|---|
| 100 | 4.20 | 4.15 | Max safe charge |
| 80 | 3.85 | 3.80 | Plateau/optimal run zone |
| 50 | 3.70 | 3.65 | Nominal, still safe |
| 20 | 3.50 | 3.45 | Warning, near depletion |
| 5 | 3.20 | 3.15 | Minimum for usable cycle life |
| 0 | 3.00 | 2.90 | Risk of permanent damage |
Tipp: Always measure the voltage at rest (not immediately after heavy use) for best accuracy.
For annotated and source-detailed tables, see Grepow’s LiPo voltage specs.
Why Voltage ≠ Capacity: The Non-Linear Reality
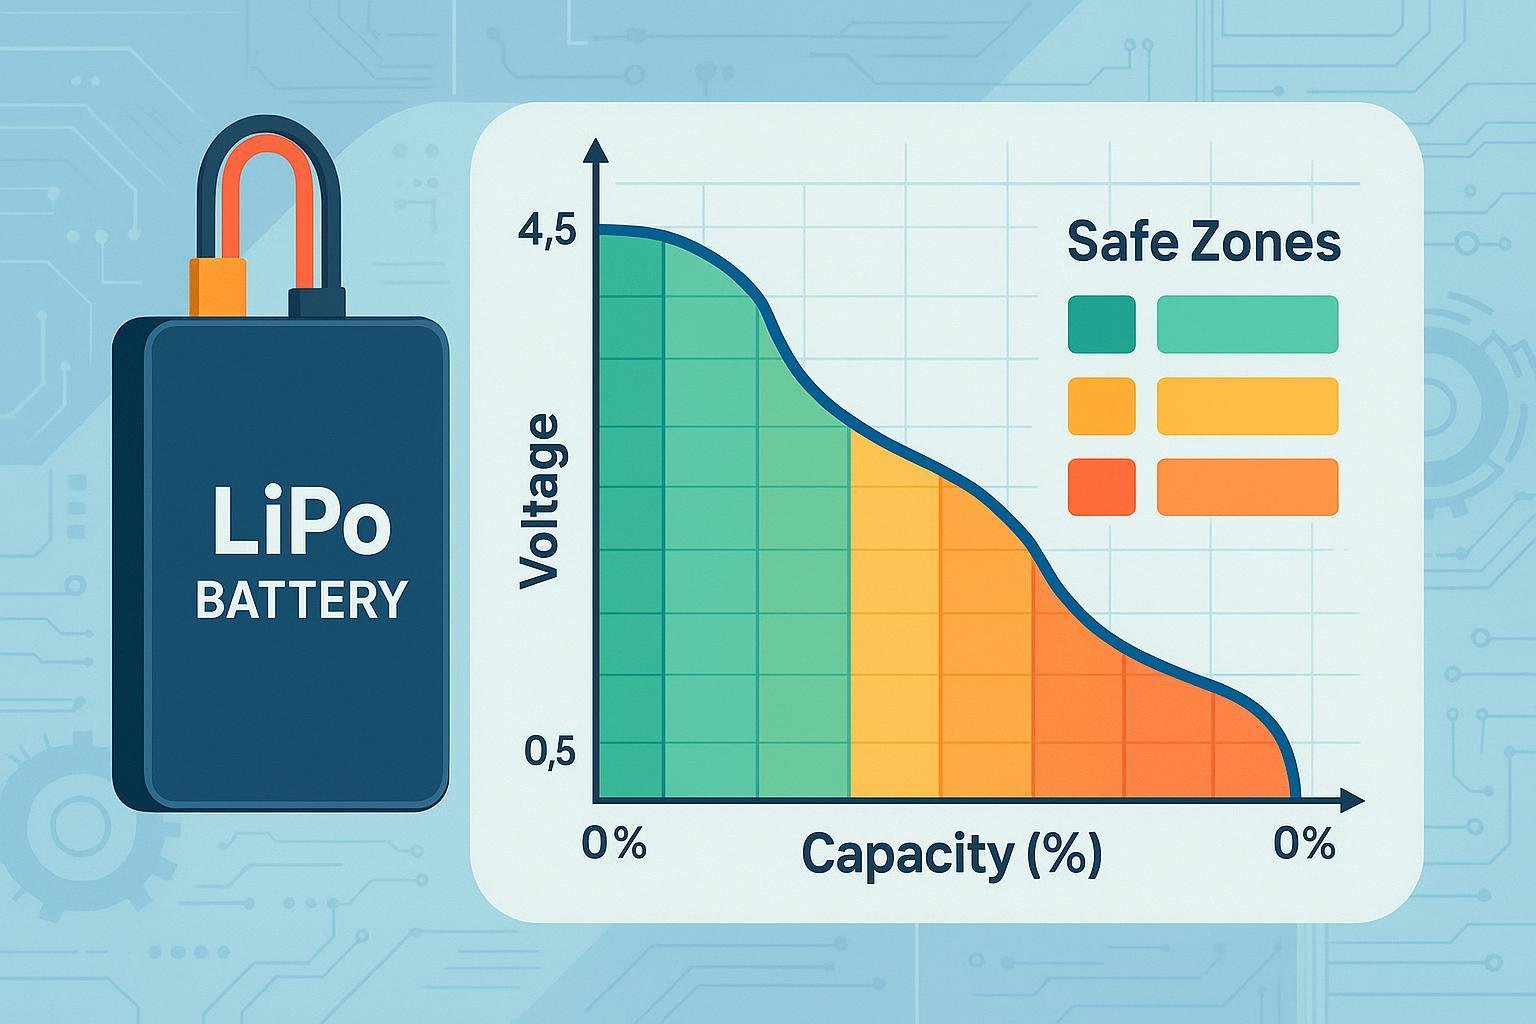
Many assume that voltage drops evenly as capacity declines. In reality, LiPo batteries have a non-linear voltage-capacity curve:
- From 4.2V to about 3.7V, capacity drops slowly—this is the “plateau.” Most usable energy is here.
- Below ~3.7V, voltage falls more rapidly and capacity vanishes quickly.
Visual Guide: Picture a fuel gauge with most graduations crammed near the top—a small voltage drop means a LOT of capacity lost at the low end.
Voltage also fluctuates with:
- Load: Heavier discharge causes voltage sag.
- Temperatur: Cold batteries read lower; warm ones slightly higher.
- Aging: Used packs sag sooner and lose actual capacity even at normal voltages.
Modern battery management systems (BMS) and smart chargers (2025 models) now combine voltage with coulomb counting and temperature compensation for more accurate capacity estimates (Ufinebattery).
Safe Voltage Boundaries: Charge, Discharge, Storage, Longevity
Keeping your LiPo within safe voltage limits prevents damage, improves cycle life, and minimizes fire risk.
| State | V/cell | Anmerkungen |
|---|---|---|
| Full Charge | 4.20 | Never exceed (risk of fire) |
| Lagerung | 3.80-3.85 | Leave for long-term rest |
| Nominell | ~3.70 | “50%” SOC, balance longevity/run |
| Minimum Usable | 3.20–3.30 | Safest deep discharge cutoff |
| Dead Zone | <3.00 | Permanent damage likely |
Best Practices:
- Balance charge always, using approved chargers.
- Store batteries at 40–60% SOC, not full or empty.
- Set device cutoff alarms to at least 3.2–3.3V/cell.
- Dispose and recycle if voltage drops under 2.5V/cell, or if swollen/damaged (OscarLiang guide).
Troubleshooting and Daily Use
Having a voltage chart is not enough—you need to recognize warning signs and act before problems escalate.
Quick Checklist:
- Imbalance: If cell voltages differ by more than 0.02V, balance charge; persistent imbalance = retirement.
- Swelling/Heat: Remove and dispose of any swelled or hot packs.
- Rapid Voltage Sag: Often signals aging cells; replace before it impacts sensitive electronics.
- Charger/BMS Fault: If your pack won’t charge, double-check mode and balance settings; some BMS units lock out unsafe packs—consult the maker’s reset guide.
For detailed troubleshooting steps, read Grepow’s advanced voltage guides.
Industry Advances: New Chemistries and Smarter Charging (2025)
LiPo technology evolves, and newer variants may have different voltage tables. Here’s a quick chemistry comparison:
| Merkmal | Standard LiPo | LiFePO4 | LiHV (High Volt LiPo) |
|---|---|---|---|
| Full Charge V/cell | 4.20 | 3.65 | 4.35 |
| Cutoff V/cell | 3.0 | 2.5 | 3.0 |
| Zyklus Leben | 300–500 | 2000+ | 300–500 |
| Sicherheit | Mäßig | Hoch | Mäßig |
Newer battery management systems (BMS) use AI and predictive algorithms to combine voltage curves, load behavior, and temperature for smarter, safer SOC estimation (Powmr LiFePO4 chart).
Related Concepts: C-Rate, Balancing, Pack Configurations & Beyond
- C-Rate: Indicates charge/discharge speed. High C-rate = faster charging/discharging; modern chargers (2025) are better optimized for high C-rates.
- Pack Configuration: Series (S) boosts voltage, parallel (P) boosts capacity.
- Cell Balancing: Keeps all cells at similar voltages; essential for safety and long battery life.
- SOC Estimation Advances: Today’s smart BMS integrate voltage, load, and aging info for precision.
Real-World Use Cases: Why Charts Matter Across Industries
- Smart Home: Solar ESS systems use voltage charts for auto load management and battery life protection (Grepow).
- Industrial Robotics: BMS monitors voltage imbalance, preventing costly downtime.
- Medical Devices: Infusion pumps log cell voltages to trigger timely warnings—keeping patients safe.
- Tragbare Elektronik: High-performance drones compare cell voltages to avoid fire risks or rapid failure.
Quick Reference Table: Safety and Best Practices
| Do | Don’t |
|---|---|
| Balance charge every cycle | Over-discharge <3.0V/cell |
| Store at ~3.8V/cell | Leave at full/empty |
| Dispose if swollen/damaged | Ignore cell imbalance |
| Use quality BMS/chargers | Charge unattended |
Final Thoughts: The Value of Voltage Chart Literacy in 2025
Mastering LiPo voltage charts is more than checking a number—it’s about understanding how your battery’s true capacity ebbs and flows, taking steps to keep your packs safe, and maximizing their lifespan across industries. Whether in drones, robots, smart homes, or life-critical medical devices, a voltage chart is your reference for safe, reliable power.
For further reading, explore:
- Basis of LiPo Battery Specifications—Grepow
- FPV Drone Battery Guide—OscarLiang
- LiPo Battery Capacity and Lifespan—Ufinebattery
Stay curious, stay safe—and make voltage charts your battery’s best friend in 2025.